


N.B. Lindberg
-
Posts
22 -
Joined
-
Last visited
N.B. Lindberg's Achievements



-
The San Diego Padres postseason chances have taken a bit of a tumble. On August 22, the Friars hit a season-high 68.9% playoff odds, according to FanGraphs’ model. Since then, they’ve gone 2-5, seen their odds drop to 47.3%, and fallen a half-game behind the Arizona Diamondbacks. All is not lost, but the Padres will have to sweat out the month of September if they want to play into October, and it could culminate in a dramatic final series. Unlike the American League, the National League playoff picture is pretty clear. The Brewers, Dodgers, and Braves will win their divisions, the Cubs and Phillies will claim the top two Wild Card spots, and the Padres and Diamondbacks will battle to the death for that final Wild Card spot. Nothing is set in stone, but the only other team with playoff odds greater than 2% are the Marlins at 4.2%. Starting with the basics, the Dodgers, despite only having the second-best record in the league, own the best divisional odds at 100% (They haven’t mathematically clinched, and the true odds are probably in the ballpark of 99.95%). Their ten-game divisional lead is the largest in baseball, and they have the easiest remaining schedule in the NL (.466), which should be enough for them to coast to a playoff spot. They have the same 82-55 record as the Braves, so a first-round bye is far from a guarantee, and that could end up being very relevant for the Padres and Diamondbacks. The Brewers own the best record in baseball (85-52), but haven’t quite locked up the division thanks to the Cubs' 77-60 record. While that nets out to an eight-game lead, the Brewers and Cubs play each other seven times from here on out. A lopsided series for the Cubs could put the division back in play, but anything close to a split probably locks in the Brewers as division champs. The Braves have the same record as the Dodgers, but their division odds are the lowest of the current National League leaders because the Phillies are 77-60. A five-game lead is great heading into the stretch run, but it’s far from insurmountable. The Braves really need to keep playing well if they want to win the division, and it’s a necessity to land a bye. The Cubs and Phillies at 77-60 have a 4.5-game lead for the top two Wild Card spots. While it’s possible one of them could fall out of it, the chance of both missing out is a rounding error. FanGraphs has their playoff odds at an identical 98.3%, which is a testament to their current lead and their overall team quality, which brings us to the true bout in the NL: Padres vs Diamondbacks. The Padres’ playoff odds sit at 47.3%, the Diamondbacks are at 49.1%, and they’re separated by a half-game. Back in the day, game 163 would be very much in play, but the expanded playoff format exchanged one of baseball’s greatest quirks for super-duper fun tiebreakers. The first tiebreaker is head-to-head record, which is where this will stop thanks to the Padres and Diamondbacks playing 13 times. However, the Padres and Diamondbacks have split their first ten games, which means their three-game set in San Diego to close the season could be for all the marbles. However, for games 160-162 to matter, they’ll have to be quite close in the standings, and that’s no given. The Diamondbacks have a slightly more difficult September than the Padres. They start with two games against the Phillies, and it is followed by three against the Astros, Royals, Rangers, Marlins, Yankees, and Rockies. Meanwhile, the Padres face the Reds, Yankees, Nationals, Giants, Rockies (in a four-game set), Marlins, and the Dodgers. A huge wild card for the Wild Card could be where the Dodgers are in the standings when they face the Padres in the penultimate series of the season. There’s a chance the Dodgers have nothing to play for as the first overall seed is out of reach, but a bye is wrapped up. On the flip side, the Dodgers might be in a dogfight for the first seed and/or a bye. Considering how weak their September schedule is, and how many reinforcements they’re expected to add, there’s a decent chance this series is there for the taking. Both the Padres and Diamondbacks have one more away game than home game, which could be a nice little boost for the Padres. While the Diamondbacks have a better road record than the Padres, the underlying metrics suggest the Padres are the far superior road team. Home D-Backs Padres Away D-Backs Padres wRC+ 104 98 wRC+ 89 100 FIP 4.30 4.05 FIP 4.48 4.26 Record 40-29 41-28 Record 33-36 31-37 Doing some quick math, we can see how the Diamondbacks and Padres would be expected to play based upon their home and road splits. By taking their home and road wRC+ and multiplying it by the league average 4.47 runs per game, we can see how many runs they’d be expected to score based on their underlying performance. Home D-Backs Padres Away D-Backs Padres Runs 4.65 4.38 Runs 3.98 4.47 FIP 4.30 4.05 FIP 4.48 4.26 Difference 0.35 0.33 Difference -0.50 0.21 The Diamondbacks' underlying metrics suggest they’re a true-talent .444 win percentage team on the road, which is far worse than their .478 mark. On the flip side, you’d expect the Padres to have a .525 road win percentage, which is far better than their current .456 figure. Obviously, these figures strip out a bunch of important context, but it does suggest that the Padres, despite a half-game deficit, should feel pretty good about their chances. They’ve been the better team, have the easier schedule, and get the final, potentially deciding, series at home. Baseball is impossible to predict, but a 14-11 kick to close the season should be enough, especially if they can take two of three against the Diamondbacks and claim the tiebreaker. View full article
-
National League Playoff Picture: Gauging Padres' Best Paths to October
N.B. Lindberg posted an article in Padres
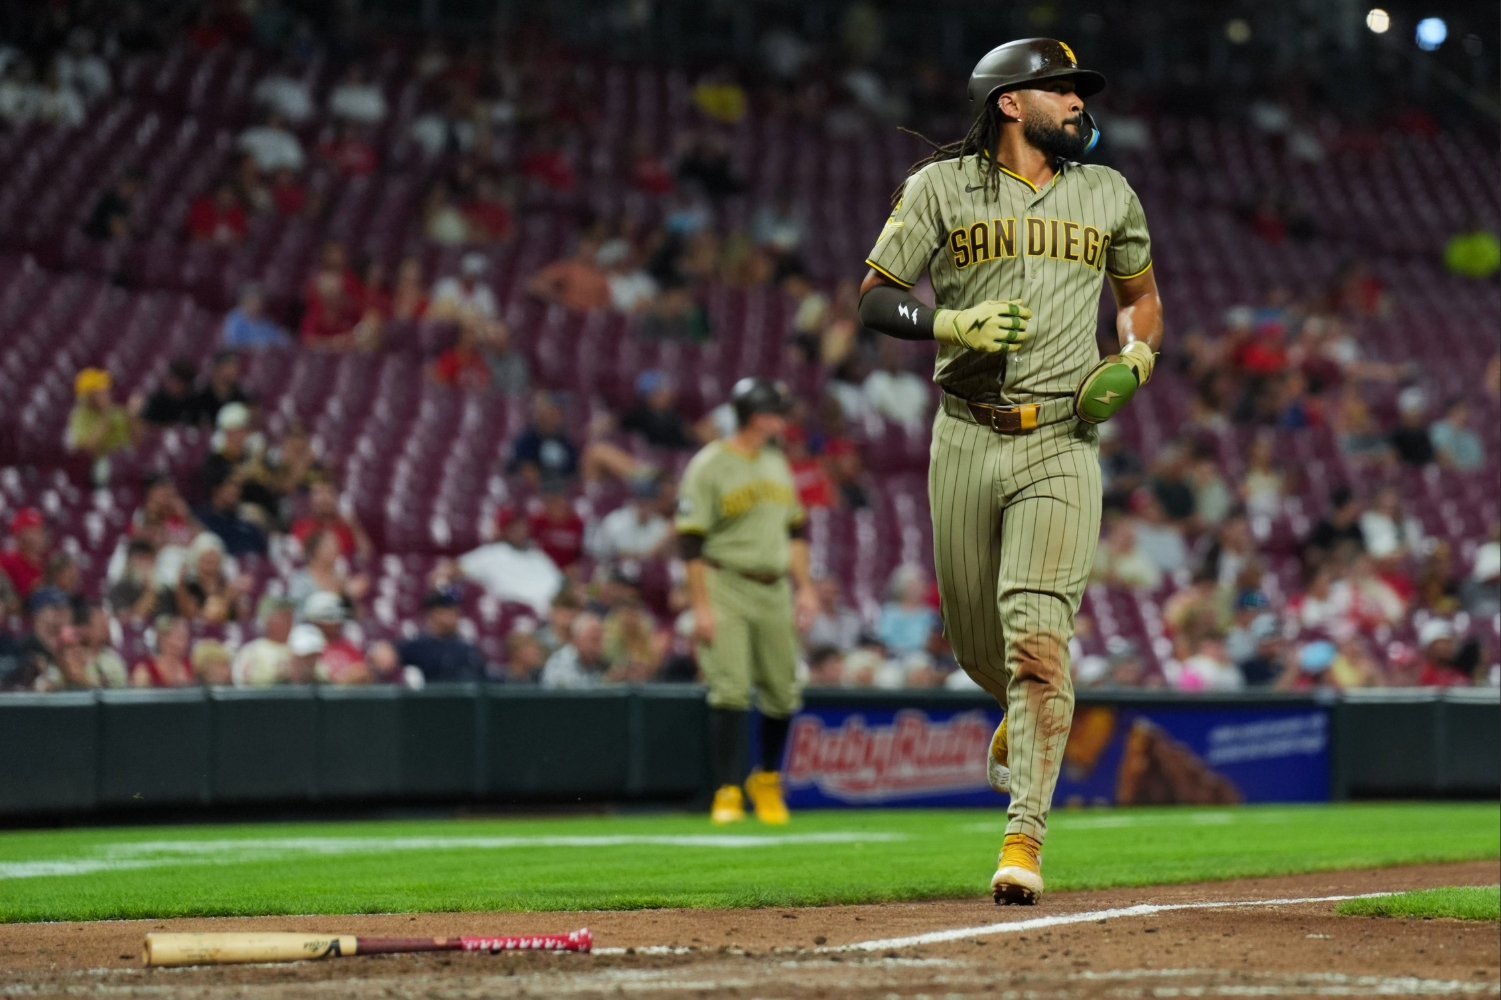 The San Diego Padres postseason chances have taken a bit of a tumble. On August 22, the Friars hit a season-high 68.9% playoff odds, according to FanGraphs’ model. Since then, they’ve gone 2-5, seen their odds drop to 47.3%, and fallen a half-game behind the Arizona Diamondbacks. All is not lost, but the Padres will have to sweat out the month of September if they want to play into October, and it could culminate in a dramatic final series. Unlike the American League, the National League playoff picture is pretty clear. The Brewers, Dodgers, and Braves will win their divisions, the Cubs and Phillies will claim the top two Wild Card spots, and the Padres and Diamondbacks will battle to the death for that final Wild Card spot. Nothing is set in stone, but the only other team with playoff odds greater than 2% are the Marlins at 4.2%. Starting with the basics, the Dodgers, despite only having the second-best record in the league, own the best divisional odds at 100% (They haven’t mathematically clinched, and the true odds are probably in the ballpark of 99.95%). Their ten-game divisional lead is the largest in baseball, and they have the easiest remaining schedule in the NL (.466), which should be enough for them to coast to a playoff spot. They have the same 82-55 record as the Braves, so a first-round bye is far from a guarantee, and that could end up being very relevant for the Padres and Diamondbacks. The Brewers own the best record in baseball (85-52), but haven’t quite locked up the division thanks to the Cubs' 77-60 record. While that nets out to an eight-game lead, the Brewers and Cubs play each other seven times from here on out. A lopsided series for the Cubs could put the division back in play, but anything close to a split probably locks in the Brewers as division champs. The Braves have the same record as the Dodgers, but their division odds are the lowest of the current National League leaders because the Phillies are 77-60. A five-game lead is great heading into the stretch run, but it’s far from insurmountable. The Braves really need to keep playing well if they want to win the division, and it’s a necessity to land a bye. The Cubs and Phillies at 77-60 have a 4.5-game lead for the top two Wild Card spots. While it’s possible one of them could fall out of it, the chance of both missing out is a rounding error. FanGraphs has their playoff odds at an identical 98.3%, which is a testament to their current lead and their overall team quality, which brings us to the true bout in the NL: Padres vs Diamondbacks. The Padres’ playoff odds sit at 47.3%, the Diamondbacks are at 49.1%, and they’re separated by a half-game. Back in the day, game 163 would be very much in play, but the expanded playoff format exchanged one of baseball’s greatest quirks for super-duper fun tiebreakers. The first tiebreaker is head-to-head record, which is where this will stop thanks to the Padres and Diamondbacks playing 13 times. However, the Padres and Diamondbacks have split their first ten games, which means their three-game set in San Diego to close the season could be for all the marbles. However, for games 160-162 to matter, they’ll have to be quite close in the standings, and that’s no given. The Diamondbacks have a slightly more difficult September than the Padres. They start with two games against the Phillies, and it is followed by three against the Astros, Royals, Rangers, Marlins, Yankees, and Rockies. Meanwhile, the Padres face the Reds, Yankees, Nationals, Giants, Rockies (in a four-game set), Marlins, and the Dodgers. A huge wild card for the Wild Card could be where the Dodgers are in the standings when they face the Padres in the penultimate series of the season. There’s a chance the Dodgers have nothing to play for as the first overall seed is out of reach, but a bye is wrapped up. On the flip side, the Dodgers might be in a dogfight for the first seed and/or a bye. Considering how weak their September schedule is, and how many reinforcements they’re expected to add, there’s a decent chance this series is there for the taking. Both the Padres and Diamondbacks have one more away game than home game, which could be a nice little boost for the Padres. While the Diamondbacks have a better road record than the Padres, the underlying metrics suggest the Padres are the far superior road team. Home D-Backs Padres Away D-Backs Padres wRC+ 104 98 wRC+ 89 100 FIP 4.30 4.05 FIP 4.48 4.26 Record 40-29 41-28 Record 33-36 31-37 Doing some quick math, we can see how the Diamondbacks and Padres would be expected to play based upon their home and road splits. By taking their home and road wRC+ and multiplying it by the league average 4.47 runs per game, we can see how many runs they’d be expected to score based on their underlying performance. Home D-Backs Padres Away D-Backs Padres Runs 4.65 4.38 Runs 3.98 4.47 FIP 4.30 4.05 FIP 4.48 4.26 Difference 0.35 0.33 Difference -0.50 0.21 The Diamondbacks' underlying metrics suggest they’re a true-talent .444 win percentage team on the road, which is far worse than their .478 mark. On the flip side, you’d expect the Padres to have a .525 road win percentage, which is far better than their current .456 figure. Obviously, these figures strip out a bunch of important context, but it does suggest that the Padres, despite a half-game deficit, should feel pretty good about their chances. They’ve been the better team, have the easier schedule, and get the final, potentially deciding, series at home. Baseball is impossible to predict, but a 14-11 kick to close the season should be enough, especially if they can take two of three against the Diamondbacks and claim the tiebreaker.
 -
The San Diego Padres' two-game lead for the final Wild Card spot is in no small part thanks to Mason Miller’s brilliance. He leads all qualified relievers in ERA (0.83), xERA (1.42), FIP (0.60), xFIP (1.46), WAR (3.3), K% (48.3%), K%-BB% (39.0%), and WPA (4.16). Pick a relevant statistic, and Miller is either the runaway leader or right at the top. He’s nails personified and is now only a month away from the greatest relief season in MLB history. Judging relief value is a bit different than position players and starters. While WAR does a great job tabulating the best starters, its context neutrality misses the mark out of the bullpen. For relievers, context is everything. You don’t bring in your closer with one out in the eighth in a one-run game with runners on first and second so he can let those inherited runners score while preserving a 0.00 ERA. No, you bring them in to put out the fire, shut the door, and put the kids to bed. Since individual relievers throw far fewer innings than they used to, Willie Hernandez’s 8.58 WPA in 1984 is about as untouchable a statistic as there is. Over 80 appearances and 140 innings, he posted a 1.90 ERA and brought home the Cy Young and MVP for his work—clearly, the players weren’t the only ones using questionable substances in the ‘80s. By WPA, Miller’s 4.16 figure only ranks 114th all-time, but that doesn’t mean he isn’t in the midst of an all-time season. His K% ranks fifth among non-2020 reliever seasons, and his FIP is staring down history. Among qualified relievers, Mason Miller’s 0.60 FIP is the best single-season mark ever. Which, unsurprisingly, means it’s the lowest single-season FIP (minimum 50 innings) ever recorded. Let that sink in. There have been 26,508 individual seasons and counting where a pitcher has reached 50 innings pitched, and Miller has, by one measure, been the most effective pitcher ever. Now, his grasp on the single most effective relief season isn’t as inevitable as he is. Craig Kimbrel’s 2012 season saw him post a 0.78 FIP, and there’s one big thing keeping Miller in the top spot: he has yet to allow a home run. FIP, short for Fielding Independent Pitching, principally takes the three things pitchers control—strikeouts, walks, and home runs—to spit out an ERA-like figure (and for FanGraphs, WAR). However, out of those three statistics, home run rate is by far the least predictive. This is why xFIP, which uses a league-average home run to flyball rate, is generally more predictive of future performance than FIP, especially when analyzing small samples. In terms of xFIP, which only goes back to 2002, if you remove 2020 from the sample, Miller’s 1.46 xFIP ranks sixth. That being said, Statcast only has Miller’s expected home runs allowed total at 0.6, so it’s not like he’s riding his luck to the top spot in history. On top of staring down FIP history, Miller has a very outside chance of claiming the top (non-2020) relief ERA season. That mark, held by Zach Britton, sits at a 0.54 ERA from 2016. Over the course of 67 innings, Britton allowed four earned runs, which means Miller, who’s at five earned runs in 54.1 innings, would have to close the season on a 29.2-inning scoreless streak to catch Britton. Even though the Padres are in the thick of a playoff race, it'd be insane to ride Miller that hard ahead of October. When chasing history, the odds are always stacked against you. If Miller had allowed a single home run this season, his FIP would stand at 0.84, which would rank second all-time to Kimbrel’s. But that doesn’t mean he’s one home run away from being out of the race. If Miller continues to pitch as frequently and just as well based on strikeout and walk rate, but does allow a single home run, he’d end the season with a 0.80 FIP in 67.1 innings. That’d still be second all-time, but he could conceivably make up some lost points of FIP by racking up strikeouts at an even higher rate, or, more likely, limiting his walks. The silver lining is that Miller’s lead on adjusted FIP is a bit more secure. Adjusted FIP takes a player’s FIP compared to the league average, where 100 is league average. Miller’s mark of 14, also the best figure ever, is five points ahead of Eric Gagne’s 19 from 2003 in second. At the end of the day, I doubt Miller cares if he sets the single-season FIP or adjusted FIP record. The Padres are fighting for a playoff spot, and a run here or there doesn’t matter so long as they win. That being said, if for some reason you want late-game situations to be even more stressful, you can root for the Padres and Miller’s chase of history. View full article
-
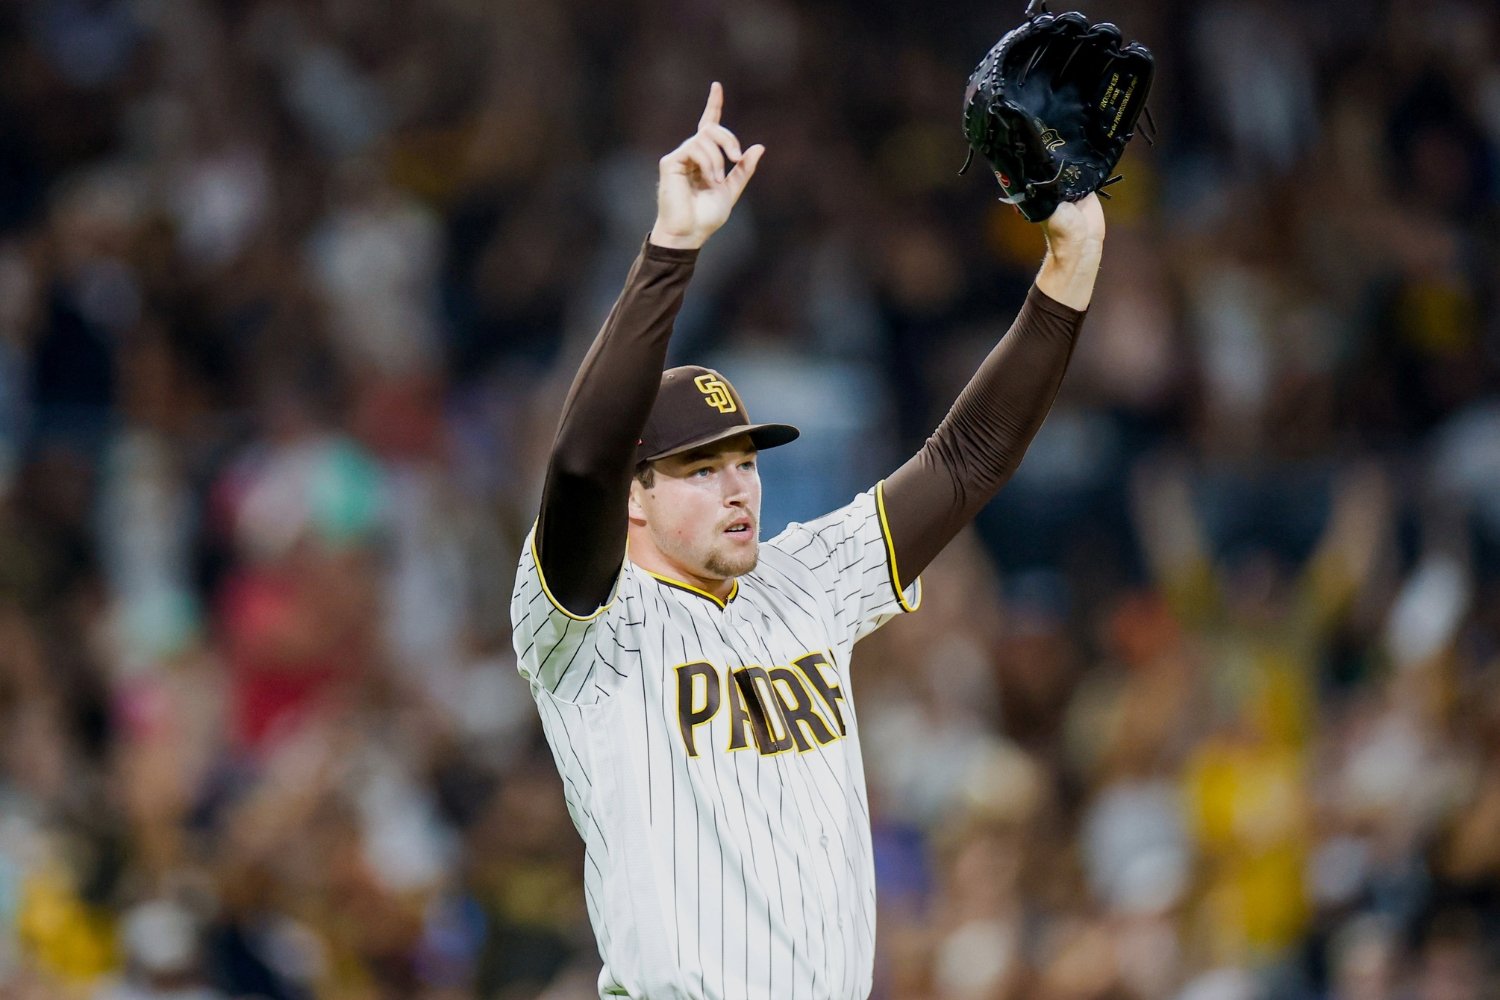 The San Diego Padres' two-game lead for the final Wild Card spot is in no small part thanks to Mason Miller’s brilliance. He leads all qualified relievers in ERA (0.83), xERA (1.42), FIP (0.60), xFIP (1.46), WAR (3.3), K% (48.3%), K%-BB% (39.0%), and WPA (4.16). Pick a relevant statistic, and Miller is either the runaway leader or right at the top. He’s nails personified and is now only a month away from the greatest relief season in MLB history. Judging relief value is a bit different than position players and starters. While WAR does a great job tabulating the best starters, its context neutrality misses the mark out of the bullpen. For relievers, context is everything. You don’t bring in your closer with one out in the eighth in a one-run game with runners on first and second so he can let those inherited runners score while preserving a 0.00 ERA. No, you bring them in to put out the fire, shut the door, and put the kids to bed. Since individual relievers throw far fewer innings than they used to, Willie Hernandez’s 8.58 WPA in 1984 is about as untouchable a statistic as there is. Over 80 appearances and 140 innings, he posted a 1.90 ERA and brought home the Cy Young and MVP for his work—clearly, the players weren’t the only ones using questionable substances in the ‘80s. By WPA, Miller’s 4.16 figure only ranks 114th all-time, but that doesn’t mean he isn’t in the midst of an all-time season. His K% ranks fifth among non-2020 reliever seasons, and his FIP is staring down history. Among qualified relievers, Mason Miller’s 0.60 FIP is the best single-season mark ever. Which, unsurprisingly, means it’s the lowest single-season FIP (minimum 50 innings) ever recorded. Let that sink in. There have been 26,508 individual seasons and counting where a pitcher has reached 50 innings pitched, and Miller has, by one measure, been the most effective pitcher ever. Now, his grasp on the single most effective relief season isn’t as inevitable as he is. Craig Kimbrel’s 2012 season saw him post a 0.78 FIP, and there’s one big thing keeping Miller in the top spot: he has yet to allow a home run. FIP, short for Fielding Independent Pitching, principally takes the three things pitchers control—strikeouts, walks, and home runs—to spit out an ERA-like figure (and for FanGraphs, WAR). However, out of those three statistics, home run rate is by far the least predictive. This is why xFIP, which uses a league-average home run to flyball rate, is generally more predictive of future performance than FIP, especially when analyzing small samples. In terms of xFIP, which only goes back to 2002, if you remove 2020 from the sample, Miller’s 1.46 xFIP ranks sixth. That being said, Statcast only has Miller’s expected home runs allowed total at 0.6, so it’s not like he’s riding his luck to the top spot in history. On top of staring down FIP history, Miller has a very outside chance of claiming the top (non-2020) relief ERA season. That mark, held by Zach Britton, sits at a 0.54 ERA from 2016. Over the course of 67 innings, Britton allowed four earned runs, which means Miller, who’s at five earned runs in 54.1 innings, would have to close the season on a 29.2-inning scoreless streak to catch Britton. Even though the Padres are in the thick of a playoff race, it'd be insane to ride Miller that hard ahead of October. When chasing history, the odds are always stacked against you. If Miller had allowed a single home run this season, his FIP would stand at 0.84, which would rank second all-time to Kimbrel’s. But that doesn’t mean he’s one home run away from being out of the race. If Miller continues to pitch as frequently and just as well based on strikeout and walk rate, but does allow a single home run, he’d end the season with a 0.80 FIP in 67.1 innings. That’d still be second all-time, but he could conceivably make up some lost points of FIP by racking up strikeouts at an even higher rate, or, more likely, limiting his walks. The silver lining is that Miller’s lead on adjusted FIP is a bit more secure. Adjusted FIP takes a player’s FIP compared to the league average, where 100 is league average. Miller’s mark of 14, also the best figure ever, is five points ahead of Eric Gagne’s 19 from 2003 in second. At the end of the day, I doubt Miller cares if he sets the single-season FIP or adjusted FIP record. The Padres are fighting for a playoff spot, and a run here or there doesn’t matter so long as they win. That being said, if for some reason you want late-game situations to be even more stressful, you can root for the Padres and Miller’s chase of history.
 -
It turns out, rumors of a San Diego Padres teardown were greatly exaggerated. Entering deadline day at 58-54, the Padres, owners of a negative run differential, pulled off two massive trades to land Robbie Ray and Casey Mize and, in one day, completely revitalize their rotation. Regardless of what you think of the man, the gall of A.J. Preller stands in stark contrast to the overly calculated character of so many modern general managers, and no matter what fate is in store for the team, they made the right choice to go all-in. The prudent thing for the Padres would have been to trade away their expiring contracts, dangle Mason Miller, and restock the farm for what could be a cold winter. All you have to do is look at the Orioles to see the path not taken. Both organizations were about two games out from the final wild card spot, but one team traded their face of the franchise, along with their starting left fielder and their best reliever, for a massive prospect haul, while the Padres added two pitchers with sub-3.10 ERAs at the cost of their second- and-third-ranked prospects. So, why did the Friars make the right decision? Well, because this team is built for now. First and foremost, the Padres possess the one luxury that is only befitting a playoff team: an absolutely nails bullpen. They lead baseball in reliever fWAR at 6.0, are sixth in ERA (3.66), first in xERA (3.28), and fifth in FIP (3.76), but even that undersells them. Due to the Padres’ underwhelming starting pitching, their bullpen has been pushed hard. The 489.1 innings they’ve gotten from the pen are the third-most in baseball, which means more innings for their lower-tier arms. For as good as the quartet of Mason Miller, Bradgley Rodriguez, Adrian Morejon, and Jeremiah Estrada are, they can’t pitch every night, and you’d still need your starter to hit five innings to line up the four horsemen of the Padocalypse. The top of the Padres’ bullpen is built for October, but the middle and back are far less effective. The best illustration of this is that Miller, Rodriguez, Morejon, and Estrada have combined to produce 6.3 of the Padres’ 6.0 fWAR out of the pen. You do the math. The addition of Mize and Ray will not only bolster a starting rotation in desperate need of quality innings, but it’ll also improve the best bullpen in baseball. If Joe Musgrove and Nick Pivetta can come back and simply fill in at the back of the rotation, the Padres could suddenly have one of the better pitching situations in the National League. Now, pitching is only half the game, and the Padres’ position players have not held up their end of the bargain. If you had told me that Jackson Merrill, Manny Machado, and Xander Bogaerts all had sub-100 wRC+’s 112 games into the season, I would have assumed the season ended sometime in June. Yet, despite three of their four most talented position players having absolutely awful offensive seasons, the Friars are right in the thick of it, which gives them a surprising amount of upward mobility. Projection systems are slow to catch sudden changes in ability, which is a feature, not a bug. It’s entirely possible that Machado, Bogaerts, and Merrill are cooked, but I also don’t buy it. Machado is a future Hall of Famer, Bogaerts is a future Hall of Very Good member, and Merrill was once one of the most promising young players in the league, and he won’t turn 24 until next April. Every single projection system thinks they’ll hit not just a bit better, but a lot better. ZIPs, which is the most pessimistic, still thinks the trio will collectively improve their wRC+ by 14 points, which is huge. Machado’s wRC+ of 97 currently ranks 114th among qualified batters. Simply adding 14 points would get him to 111 and vault him up to 70th. On top of that, the turnaround has already begun. Since June 1, Machado has a wRC+ of 120 and Merrill’s comes in at 106. There’s no reason to believe they can’t go higher, and if Bogaert’s can join the party, the Padres should have a playoff-worthy offense. Throw in Fernando Tatis Jr.’s rediscovery of his power stroke, and the Padres we thought we’d see are coming back into focus. The final piece of the puzzle is how uncertain the Padres’ future is. Machado and Bogaerts will be in their age-34 seasons in 2027, and the potential for a new CBA could absolutely hamstring them. While I doubt the next CBA will actually usher in much change, the Padres would be hit extremely hard if more stringent caps and penalties are added to the luxury tax offenders. Unlike the Dodgers, the Padres don’t have the financial resources to blow by the luxury tax while incurring increasingly draconian penalties. While everyone wants to kneecap the richest teams, those same penalties absolutely obliterate any mid-or-small-market team with the courage to spend. Simply put, a new CBA could necessitate a fire sale. The Padres and A.J. Preller have been trying to win a World Series, and 2026 is probably their last best chance with this core. People love to celebrate a calculated retreat and will prospect clutch until their knuckles are blue, but the game is about glory. This isn’t war. Dying with your sword in hand should be the expectation because everyone still gets to go home. The Padres are going for it not because it’s the smartest thing to do, but because it’s the right thing to do. Your window isn’t open forever, but it is now, and after their deadline, it might be as open as it’ll be for quite some time. View full article
-
Why Going All-In At Trade Deadline Was the Right Decision for Padres
N.B. Lindberg posted an article in Padres
 It turns out, rumors of a San Diego Padres teardown were greatly exaggerated. Entering deadline day at 58-54, the Padres, owners of a negative run differential, pulled off two massive trades to land Robbie Ray and Casey Mize and, in one day, completely revitalize their rotation. Regardless of what you think of the man, the gall of A.J. Preller stands in stark contrast to the overly calculated character of so many modern general managers, and no matter what fate is in store for the team, they made the right choice to go all-in. The prudent thing for the Padres would have been to trade away their expiring contracts, dangle Mason Miller, and restock the farm for what could be a cold winter. All you have to do is look at the Orioles to see the path not taken. Both organizations were about two games out from the final wild card spot, but one team traded their face of the franchise, along with their starting left fielder and their best reliever, for a massive prospect haul, while the Padres added two pitchers with sub-3.10 ERAs at the cost of their second- and-third-ranked prospects. So, why did the Friars make the right decision? Well, because this team is built for now. First and foremost, the Padres possess the one luxury that is only befitting a playoff team: an absolutely nails bullpen. They lead baseball in reliever fWAR at 6.0, are sixth in ERA (3.66), first in xERA (3.28), and fifth in FIP (3.76), but even that undersells them. Due to the Padres’ underwhelming starting pitching, their bullpen has been pushed hard. The 489.1 innings they’ve gotten from the pen are the third-most in baseball, which means more innings for their lower-tier arms. For as good as the quartet of Mason Miller, Bradgley Rodriguez, Adrian Morejon, and Jeremiah Estrada are, they can’t pitch every night, and you’d still need your starter to hit five innings to line up the four horsemen of the Padocalypse. The top of the Padres’ bullpen is built for October, but the middle and back are far less effective. The best illustration of this is that Miller, Rodriguez, Morejon, and Estrada have combined to produce 6.3 of the Padres’ 6.0 fWAR out of the pen. You do the math. The addition of Mize and Ray will not only bolster a starting rotation in desperate need of quality innings, but it’ll also improve the best bullpen in baseball. If Joe Musgrove and Nick Pivetta can come back and simply fill in at the back of the rotation, the Padres could suddenly have one of the better pitching situations in the National League. Now, pitching is only half the game, and the Padres’ position players have not held up their end of the bargain. If you had told me that Jackson Merrill, Manny Machado, and Xander Bogaerts all had sub-100 wRC+’s 112 games into the season, I would have assumed the season ended sometime in June. Yet, despite three of their four most talented position players having absolutely awful offensive seasons, the Friars are right in the thick of it, which gives them a surprising amount of upward mobility. Projection systems are slow to catch sudden changes in ability, which is a feature, not a bug. It’s entirely possible that Machado, Bogaerts, and Merrill are cooked, but I also don’t buy it. Machado is a future Hall of Famer, Bogaerts is a future Hall of Very Good member, and Merrill was once one of the most promising young players in the league, and he won’t turn 24 until next April. Every single projection system thinks they’ll hit not just a bit better, but a lot better. ZIPs, which is the most pessimistic, still thinks the trio will collectively improve their wRC+ by 14 points, which is huge. Machado’s wRC+ of 97 currently ranks 114th among qualified batters. Simply adding 14 points would get him to 111 and vault him up to 70th. On top of that, the turnaround has already begun. Since June 1, Machado has a wRC+ of 120 and Merrill’s comes in at 106. There’s no reason to believe they can’t go higher, and if Bogaert’s can join the party, the Padres should have a playoff-worthy offense. Throw in Fernando Tatis Jr.’s rediscovery of his power stroke, and the Padres we thought we’d see are coming back into focus. The final piece of the puzzle is how uncertain the Padres’ future is. Machado and Bogaerts will be in their age-34 seasons in 2027, and the potential for a new CBA could absolutely hamstring them. While I doubt the next CBA will actually usher in much change, the Padres would be hit extremely hard if more stringent caps and penalties are added to the luxury tax offenders. Unlike the Dodgers, the Padres don’t have the financial resources to blow by the luxury tax while incurring increasingly draconian penalties. While everyone wants to kneecap the richest teams, those same penalties absolutely obliterate any mid-or-small-market team with the courage to spend. Simply put, a new CBA could necessitate a fire sale. The Padres and A.J. Preller have been trying to win a World Series, and 2026 is probably their last best chance with this core. People love to celebrate a calculated retreat and will prospect clutch until their knuckles are blue, but the game is about glory. This isn’t war. Dying with your sword in hand should be the expectation because everyone still gets to go home. The Padres are going for it not because it’s the smartest thing to do, but because it’s the right thing to do. Your window isn’t open forever, but it is now, and after their deadline, it might be as open as it’ll be for quite some time.
 -
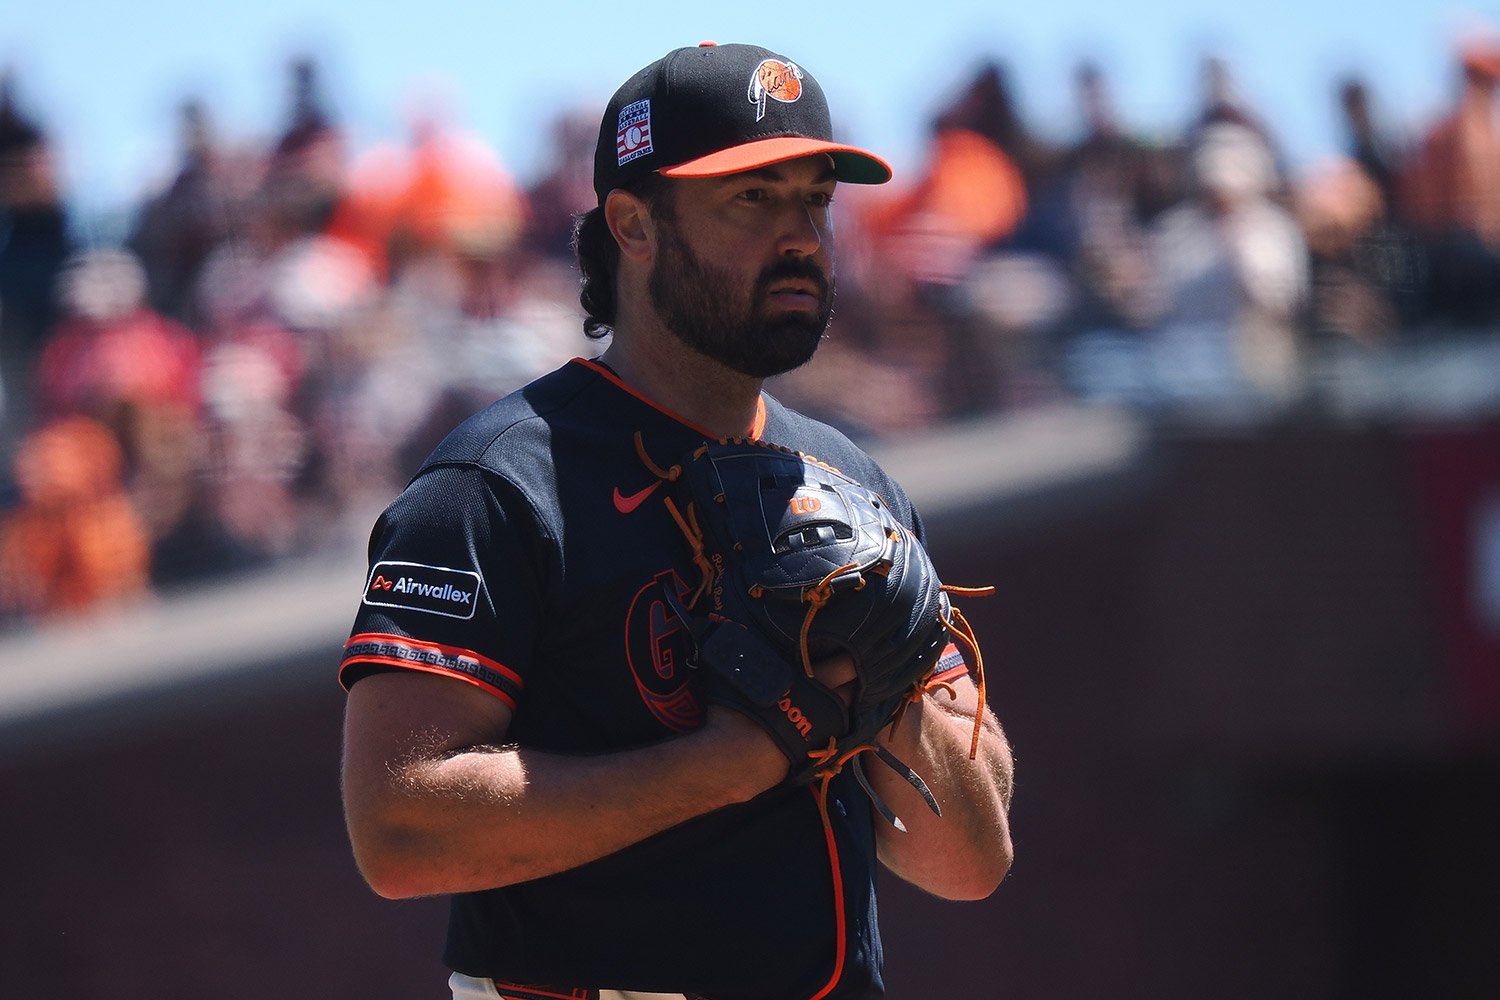 The San Diego Padres and San Fransico Giants are finalizing a trade that will send Robbie Ray down Interstate 5 to San Diego, per Jeff Passan of ESPN. In return, the Giants are landing Miguel Mendez and Joniel Hernandez, per Robert Murray of Fansided. Mendez, a right-handed pitcher, is ranked as the organization’s third-ranked prospect by Padres Mission. Ray is in the final year of a five-year, $115 million deal he originally signed with the Seattle Mariners. With a $25 million salary for 2026, the Giants are reportedly covering half of his remaining money. The Padres will pay $4.6 million in salary to Ray, which will help them stay in the repeater 30% luxury tax bracket and prevent them from going into the second luxury tax bracket. Currently, the Padres have a $261 million projected payroll tax with the competitive balance threshold set at $244 million; the Giants eating half of Ray's remaining salary prevents the Padres from going $20 million over and incurring a 42% tax penalty. The Padres, who looked to be on the fence as buyers or sellers, appear to be pushing their chips in. Ray should help bolster the back end of a rotation that has struggled for consistency and production. His 3.08 ERA this season would lead all qualified Padres’ starters, although his ERA estimators all have his ERA in the mid-4.00s. Despite the divergence in Ray's expected versus actual statistics, he'll provide the middle of the Padres' rotation some much-needed stability. After tearing his UCL in 2023, Ray made 32 starts in 2025 and is up to 21 this season. However, his durability might not be his only selling point. Ray's strikeout and walk figures have backed up compared to last season, but he may be underperforming his walk figures. Despite throwing a first-pitch strike 60.4% of the time, above his career mark of 59.6%, he's seen his walk rate balloon to 11.1% thanks to a zone rate of 43.4%, against a career average of 47.6%. Ray's approach appears to be to get strike one and then try to entice chase out of the zone. After scraping his sinker in 2023, Ray has reintroduced the pitch this season, which helps to explain some of his drop in strikeout rate, as sinkers notoriously don't miss many bats. On top of relying more on his sinker, his four-seamer has lost some of its effectiveness in the zone, going from an 85% in-zone contact rate in 2025 to 91.5% in 2026. However, the pitch has remained effective out of the zone, at a still solid 69.1% out-of-zone contact rate. When Ray has been at his best, his four-seamer has been his money pitch, but this season, both his curveball and change-up are performing well. Should the Padres get his pitch mix and approach right, there's a chance Ray's ERA estimators could trend towards his sterling ERA, but don't expect him to maintain his 3.08 ERA. Miguel Mendez is one of the higher-variance pitching prospects in the minors, and now it'll be up to the Giants to iron him out as a starter or let him air it out in relief. Listed at 6'2, 165 lbs, Mendez is a lean, loose athlete who uses his whole body to whip in a plus fastball and slider. Unfortunately, his max-effort delivery makes the command aspect of his operation a roller coaster. Already 24 and walking 10.9% of batters in AA, the chances Mendez ends up a starter are getting as slim as he is. That being said, it doesn't take much imagination to see him move to the pen and become a monster leverage arm. Joniel Hernandez is the quintessential teenage lottery ticket. Signed out of Cuba this January, the 17-year-old Hernandez is performing well in the Dominican Summer League. Currently deployed as a shortstop, he has the athleticism to stay at an up-the-middle position, but he isn't so polished with the glove that he's viewed as a lock to stay there. Still, Hernandez has tremendous athleticism, which gives him tantalizing upside, which comes with a helping of swing-and-miss bust risk. In 24-months, his inclusion in the trade could look like a grave mistake, or he could be struggling on the complex. That's the risk-reward with teenage lottery tickets.
 -
The San Diego Padres and San Fransico Giants are finalizing a trade that will send Robbie Ray down Interstate 5 to San Diego, per Jeff Passan of ESPN. In return, the Giants are landing Miguel Mendez and Joniel Hernandez, per Robert Murray of Fansided. Mendez, a right-handed pitcher, is ranked as the organization’s third-ranked prospect by Padres Mission. Ray is in the final year of a five-year, $115 million deal he originally signed with the Seattle Mariners. With a $25 million salary for 2026, the Giants are reportedly covering half of his remaining money. The Padres will pay $4.6 million in salary to Ray, which will help them stay in the repeater 30% luxury tax bracket and prevent them from going into the second luxury tax bracket. Currently, the Padres have a $261 million projected payroll tax with the competitive balance threshold set at $244 million; the Giants eating half of Ray's remaining salary prevents the Padres from going $20 million over and incurring a 42% tax penalty. The Padres, who looked to be on the fence as buyers or sellers, appear to be pushing their chips in. Ray should help bolster the back end of a rotation that has struggled for consistency and production. His 3.08 ERA this season would lead all qualified Padres’ starters, although his ERA estimators all have his ERA in the mid-4.00s. Despite the divergence in Ray's expected versus actual statistics, he'll provide the middle of the Padres' rotation some much-needed stability. After tearing his UCL in 2023, Ray made 32 starts in 2025 and is up to 21 this season. However, his durability might not be his only selling point. Ray's strikeout and walk figures have backed up compared to last season, but he may be underperforming his walk figures. Despite throwing a first-pitch strike 60.4% of the time, above his career mark of 59.6%, he's seen his walk rate balloon to 11.1% thanks to a zone rate of 43.4%, against a career average of 47.6%. Ray's approach appears to be to get strike one and then try to entice chase out of the zone. After scraping his sinker in 2023, Ray has reintroduced the pitch this season, which helps to explain some of his drop in strikeout rate, as sinkers notoriously don't miss many bats. On top of relying more on his sinker, his four-seamer has lost some of its effectiveness in the zone, going from an 85% in-zone contact rate in 2025 to 91.5% in 2026. However, the pitch has remained effective out of the zone, at a still solid 69.1% out-of-zone contact rate. When Ray has been at his best, his four-seamer has been his money pitch, but this season, both his curveball and change-up are performing well. Should the Padres get his pitch mix and approach right, there's a chance Ray's ERA estimators could trend towards his sterling ERA, but don't expect him to maintain his 3.08 ERA. Miguel Mendez is one of the higher-variance pitching prospects in the minors, and now it'll be up to the Giants to iron him out as a starter or let him air it out in relief. Listed at 6'2, 165 lbs, Mendez is a lean, loose athlete who uses his whole body to whip in a plus fastball and slider. Unfortunately, his max-effort delivery makes the command aspect of his operation a roller coaster. Already 24 and walking 10.9% of batters in AA, the chances Mendez ends up a starter are getting as slim as he is. That being said, it doesn't take much imagination to see him move to the pen and become a monster leverage arm. Joniel Hernandez is the quintessential teenage lottery ticket. Signed out of Cuba this January, the 17-year-old Hernandez is performing well in the Dominican Summer League. Currently deployed as a shortstop, he has the athleticism to stay at an up-the-middle position, but he isn't so polished with the glove that he's viewed as a lock to stay there. Still, Hernandez has tremendous athleticism, which gives him tantalizing upside, which comes with a helping of swing-and-miss bust risk. In 24-months, his inclusion in the trade could look like a grave mistake, or he could be struggling on the complex. That's the risk-reward with teenage lottery tickets. View full article
-
As a true .500 team entering the second half, the San Diego Padres are right on the buy/sell fence. They’re close enough to the playoffs where pushing their chips would be defensible, but so would a calculated retreat. And the player who sits atop the proverbial fence is Michael King. King has been at the forefront of the modern reliever-to-starter conversion. Between 2019 and 2023 with the Yankees, King made 19 starts against 96 relief appearances and excelled. As a spot starter and multi-inning reliever, he pitched to a 3.38 ERA and amassed 4.7 fWAR and 5.6 bWAR. For just 247.2 innings of work, those are excellent figures, and continuing as a bullpen fireman would have been an apt career choice. Why zig when the zagging is so swell? Well, the Padres had other, better ideas. King arrived in San Diego in 2024 as part of the Juan Soto trade, and instead of trotting out of the bullpen 50 times a season, the Padres decided to see if he could toe the rubber every fifth day. At the time, there was significant skepticism that King could make the transition, but he quickly and emphatically put those to bed. In 2024, King made 30 starts and earned a 2.95 ERA across 173.2 innings. It was good for 3.9 fWAR and 4.1 bWAR. That’s not quite ace-like production, but if that’s your number three starter, you’ve got yourself a great rotation. His 2025 wasn’t quite as sterling as injury limited him to 15 starts, but he still finished the season with a 3.44 ERA. And now in year three of his major league starting career, he has made 20 starts with a 3.34 ERA over 113.1 innings. King has been, without a doubt, the Padres' best starter. He leads their starting rotation in innings, ERA, fWAR (1.7), and bWAR (2.6), with the latter figure leading the entire team. If he were to seriously be available at the deadline, he’d be one of the top pitchers on the market, but he’d also be the proverbial white flag raised from the white picket fence. However, the decision to trade King isn’t as simple as quitting on this season, as he has a player option for the next two, which makes his trade candidacy a compelling thought exercise. The first place to start with a King trade is with that player option. The deal he signed with the Padres was an act of creative accounting. After so much success in San Diego, the Padres re-signed King to a three-year, $75 million deal this offseason, but it was really a one-year deal worth $17 million with an option for two years and $58 million. His average annual value of $25 million is spread evenly over the contract for luxury tax purposes, while the cash payouts escalate rapidly. The deal was structured this way to help offset their massive luxury tax figure of $258.4 million against just $230.6 million in projected cash payroll. Due to the Padres being above the $244 million competitive balance tax, they are set to pay $4.34 million in luxury tax. King, by only making $17 million in cash this season, helped offset the Padres' luxury tax payments and reduce their total cash expenditures for the 2026 season. Unfortunately, everything changes in 2027 and 2028. King’s cash payout increases to $28 million in the former year and $30 million in the latter, but that’s just the tip of the financial iceberg the Padres are steaming towards. Starting in 2027, Manny Machado’s salary bumps up to $40 million from $21 million, against the flat $31.8 million luxury tax figure for the life of his deal. While Jackson Merrill’s contract helps alleviate this spike, the Padres functionally built this roster to have a financial crunch in 2027, and King’s contract structure is a prime example. If King were to opt into his deal for 2027 and 2028, the Padres would very likely feel compelled to offload salary, so why not get ahead of disaster and move one of their most moveable contracts early? The financial motivations to trade King ahead of the deadline are massive, and while his contract structure might be a hindrance to a less cash-rich franchise like the Padres, his lower competitive balance hit, compared to his salary, might be awfully enticing for a franchise that prints money. Now, you can’t move a player as important as King just for financial reasons. He’s your best starting pitcher, and you’re still in the playoff picture. However, the return for King could help restock a depleted farm system. With Machado’s looming salary explosion and drop in production, the Padres' best hope of competing over the next half-decade is to receive an infusion of young, cost-controlled talent to offset an underwater contract. While there will undoubtedly be massive interest in King, presumably from the Cubs, his value league-wide will be incredibly interesting. As I’m sure you’ve noticed, I keep mentioning his fWAR and bWAR, with his bWAR always being superior, and there’s a reason for that. King has spent the past three seasons continuously beating his ERA estimators, which fWAR (Fangraphs) is based upon, while bWAR (Baseball Reference) uses ERA with a team defense weight. *2026 stats capture only the first half After a certain point, if a player keeps beating their ERA estimators, you have to believe they’ll keep doing so. Unfortunately, the team trading for him has to believe that as well, and front offices have never been more sophisticated in their player analysis. Landing a starter who can give you a mid-threes ERA over 180 innings is game-changing, but getting that level of bulk with an ERA at or above 4.00 is more of a backend starter. Over the past three seasons, among starters who have thrown 300 or more innings, King has the sixth-largest gap between his actual ERA and the average of his ERA estimators. This has been great for the Padres, but it will undoubtedly scare some teams off. The other confounding issue has been the erosion of his strikeout rate. In 2024, King posted a 27.7% strikeout rate, but that fell to 24.7% in 2025, and currently sits at 20.7% in 2026. Even if we view his 2024 season as a career year, the drop in strikeouts, combined with a corresponding increase in walk rate (a career high 9.7% this season), is likely to mute his market. However, based on King’s underlying contact, zone, and swing data, he’s probably underperforming his strikeout and walk rates a tad. If an enterprising team believes they can get his stuff to play better out of the zone, King should see his strikeout rate skyrocket, as it’s unusual for a player to miss bats in the zone, but not out of it. As for his walk rate, no player who is in the zone this much, throwing a league-average number of first-pitch strikes, should have a below-league-average walk rate. The question for any team trading for King is whether or not they think they can continue to get the same level of performance despite some yellow flags. With how pitching-needy teams are by the trade deadline, teams will certainly be interested in a relatively durable and stable starting pitcher under contract for the next two seasons, but is he worth moving if he can only net one back-end top-100 prospect? There are more reasons to move King than keep him, but waiving the white flag is something front offices should always do with caution. And even if the move makes long-term sense, if the Padres execute a quick turnaround or Machado, Jackson Merrill, and Xander Bogaerts start playing up to their usual standards, then King is the exact type of steadying mid-rotation force they’d need. All told, the case to keep or move King is as on the fence as the Padres’ season. But whatever they decide to do with him will tell us what they really think of this team. View full article
-
Padres' Trade Deadline Plans Will Be Unfurled By Michael King
N.B. Lindberg posted an article in Padres
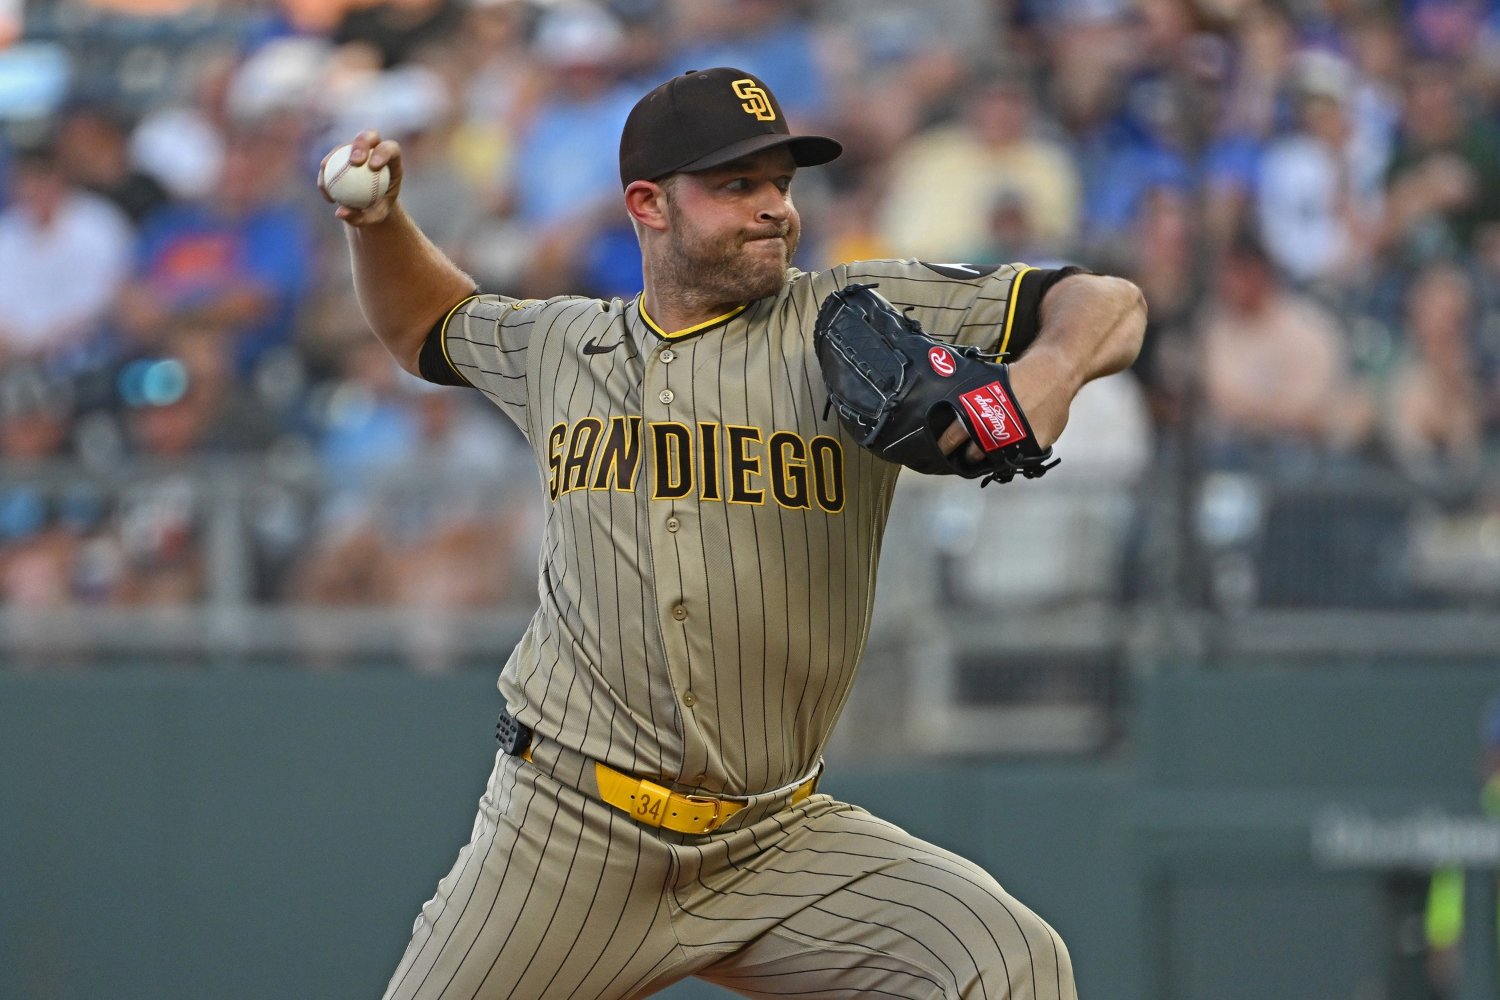 As a true .500 team entering the second half, the San Diego Padres are right on the buy/sell fence. They’re close enough to the playoffs where pushing their chips would be defensible, but so would a calculated retreat. And the player who sits atop the proverbial fence is Michael King. King has been at the forefront of the modern reliever-to-starter conversion. Between 2019 and 2023 with the Yankees, King made 19 starts against 96 relief appearances and excelled. As a spot starter and multi-inning reliever, he pitched to a 3.38 ERA and amassed 4.7 fWAR and 5.6 bWAR. For just 247.2 innings of work, those are excellent figures, and continuing as a bullpen fireman would have been an apt career choice. Why zig when the zagging is so swell? Well, the Padres had other, better ideas. King arrived in San Diego in 2024 as part of the Juan Soto trade, and instead of trotting out of the bullpen 50 times a season, the Padres decided to see if he could toe the rubber every fifth day. At the time, there was significant skepticism that King could make the transition, but he quickly and emphatically put those to bed. In 2024, King made 30 starts and earned a 2.95 ERA across 173.2 innings. It was good for 3.9 fWAR and 4.1 bWAR. That’s not quite ace-like production, but if that’s your number three starter, you’ve got yourself a great rotation. His 2025 wasn’t quite as sterling as injury limited him to 15 starts, but he still finished the season with a 3.44 ERA. And now in year three of his major league starting career, he has made 20 starts with a 3.34 ERA over 113.1 innings. King has been, without a doubt, the Padres' best starter. He leads their starting rotation in innings, ERA, fWAR (1.7), and bWAR (2.6), with the latter figure leading the entire team. If he were to seriously be available at the deadline, he’d be one of the top pitchers on the market, but he’d also be the proverbial white flag raised from the white picket fence. However, the decision to trade King isn’t as simple as quitting on this season, as he has a player option for the next two, which makes his trade candidacy a compelling thought exercise. The first place to start with a King trade is with that player option. The deal he signed with the Padres was an act of creative accounting. After so much success in San Diego, the Padres re-signed King to a three-year, $75 million deal this offseason, but it was really a one-year deal worth $17 million with an option for two years and $58 million. His average annual value of $25 million is spread evenly over the contract for luxury tax purposes, while the cash payouts escalate rapidly. The deal was structured this way to help offset their massive luxury tax figure of $258.4 million against just $230.6 million in projected cash payroll. Due to the Padres being above the $244 million competitive balance tax, they are set to pay $4.34 million in luxury tax. King, by only making $17 million in cash this season, helped offset the Padres' luxury tax payments and reduce their total cash expenditures for the 2026 season. Unfortunately, everything changes in 2027 and 2028. King’s cash payout increases to $28 million in the former year and $30 million in the latter, but that’s just the tip of the financial iceberg the Padres are steaming towards. Starting in 2027, Manny Machado’s salary bumps up to $40 million from $21 million, against the flat $31.8 million luxury tax figure for the life of his deal. While Jackson Merrill’s contract helps alleviate this spike, the Padres functionally built this roster to have a financial crunch in 2027, and King’s contract structure is a prime example. If King were to opt into his deal for 2027 and 2028, the Padres would very likely feel compelled to offload salary, so why not get ahead of disaster and move one of their most moveable contracts early? The financial motivations to trade King ahead of the deadline are massive, and while his contract structure might be a hindrance to a less cash-rich franchise like the Padres, his lower competitive balance hit, compared to his salary, might be awfully enticing for a franchise that prints money. Now, you can’t move a player as important as King just for financial reasons. He’s your best starting pitcher, and you’re still in the playoff picture. However, the return for King could help restock a depleted farm system. With Machado’s looming salary explosion and drop in production, the Padres' best hope of competing over the next half-decade is to receive an infusion of young, cost-controlled talent to offset an underwater contract. While there will undoubtedly be massive interest in King, presumably from the Cubs, his value league-wide will be incredibly interesting. As I’m sure you’ve noticed, I keep mentioning his fWAR and bWAR, with his bWAR always being superior, and there’s a reason for that. King has spent the past three seasons continuously beating his ERA estimators, which fWAR (Fangraphs) is based upon, while bWAR (Baseball Reference) uses ERA with a team defense weight. *2026 stats capture only the first half After a certain point, if a player keeps beating their ERA estimators, you have to believe they’ll keep doing so. Unfortunately, the team trading for him has to believe that as well, and front offices have never been more sophisticated in their player analysis. Landing a starter who can give you a mid-threes ERA over 180 innings is game-changing, but getting that level of bulk with an ERA at or above 4.00 is more of a backend starter. Over the past three seasons, among starters who have thrown 300 or more innings, King has the sixth-largest gap between his actual ERA and the average of his ERA estimators. This has been great for the Padres, but it will undoubtedly scare some teams off. The other confounding issue has been the erosion of his strikeout rate. In 2024, King posted a 27.7% strikeout rate, but that fell to 24.7% in 2025, and currently sits at 20.7% in 2026. Even if we view his 2024 season as a career year, the drop in strikeouts, combined with a corresponding increase in walk rate (a career high 9.7% this season), is likely to mute his market. However, based on King’s underlying contact, zone, and swing data, he’s probably underperforming his strikeout and walk rates a tad. If an enterprising team believes they can get his stuff to play better out of the zone, King should see his strikeout rate skyrocket, as it’s unusual for a player to miss bats in the zone, but not out of it. As for his walk rate, no player who is in the zone this much, throwing a league-average number of first-pitch strikes, should have a below-league-average walk rate. The question for any team trading for King is whether or not they think they can continue to get the same level of performance despite some yellow flags. With how pitching-needy teams are by the trade deadline, teams will certainly be interested in a relatively durable and stable starting pitcher under contract for the next two seasons, but is he worth moving if he can only net one back-end top-100 prospect? There are more reasons to move King than keep him, but waiving the white flag is something front offices should always do with caution. And even if the move makes long-term sense, if the Padres execute a quick turnaround or Machado, Jackson Merrill, and Xander Bogaerts start playing up to their usual standards, then King is the exact type of steadying mid-rotation force they’d need. All told, the case to keep or move King is as on the fence as the Padres’ season. But whatever they decide to do with him will tell us what they really think of this team.
 -
Where would the San Diego Padres be without Ty France? It’s impossible to know, but they almost certainly wouldn’t be 32-27. His 137 wRC+ leads the team among players with over 100 plate appearances, but that’s not really the interesting part. Unheralded players go through hot streaks all the time and carry their team in the process. While France has done that to some degree, it’s how he’s doing that which is noteworthy. Modern baseball hitting philosophy can be boiled down to three words: lift and pull. The reason for this is relatively simple. When you lift and pull, you’re more likely to hit the ball hard and in the air, which leads to extra bases. On top of that, if the pitcher knows you can do serious damage on contact, they pitch you more carefully, which means more balls and more walks. Functionally, lifting and pulling the ball leads to more power and on-base, which is kind of the name of the game. However, every hitter is different, and there is no one-size-fits-all approach, which brings us back to Ty France. France has gotten off to a torrid start by hitting the crap out of the ball. His 3.6% walk rate is scary, especially next to a 23.4% strikeout rate, but when you make that much contact and pair it with a 50% hard-hit rate, you can prosper. What is unusual is that France isn’t lifting and pulling his way to glory; in fact, he’s doing the opposite. On average, major leaguers pull 41% of their contact and go to the opposite field 23.7% of the time. By this metric, France doesn’t really stand out. He’s pulling 41.8% of his contact and going the other way at a 21.5% rate. However, that doesn’t mean he isn’t one of the most opposite-field-oriented hitters in baseball. On pulled contact, France is hitting fly balls 18.2% of the time, compared to the MLB average of 24.9%, and 58.8% of his opposite field contact are fly balls, against the MLB average of 62.20%. So, while France pulls the ball in the air much less than average, that’s still not really what makes him so interesting. Where you hit the ball is less important than how well you hit the ball. If you hit the ball hard enough, you have much more leeway with spray and launch angle, and this is where France has zigged where everyone else has zagged. France is currently sporting a 47.1% hard-hit rate on balls to the opposite field. If he had enough plate appearances to qualify, he’d rank third in that metric, behind only James Wood and Drake Baldwin, and even that undersells what he’s doing. On average, the MLB hard-hit rate is only 20.5% on balls to the opposite field, which France is more than doubling. When you factor in that France has a 29.4% line drive rate, on top of a 58.8% field fly ball rate, it’s easy to see why this unique profile is working. He’s lifting and crushing pitches to the opposite field in a way that few hitters have. Lift and pull isn’t actually about pulling the ball. In general, most hitters simply hit the ball harder to the pull side and struggle mightily to go the other way with authority. The thing is, France is not one of those hitters. He is elite at hitting the ball hard in the air to the opposite field, so why should he stop? Over the long haul, I doubt France will continue to run a wOBA of .368, as he has an xwOBA of .336, but that’d still constitute a successful bounce back after two mostly forgettable seasons. However, even if his production erodes, the first two months of the season have taught us a lesson: Hitting the ball hard, even the other way, is the key to hitting. View full article
-
Ty France Is A Reminder That Baseball Isn't One Size Fits All
N.B. Lindberg posted an article in Padres
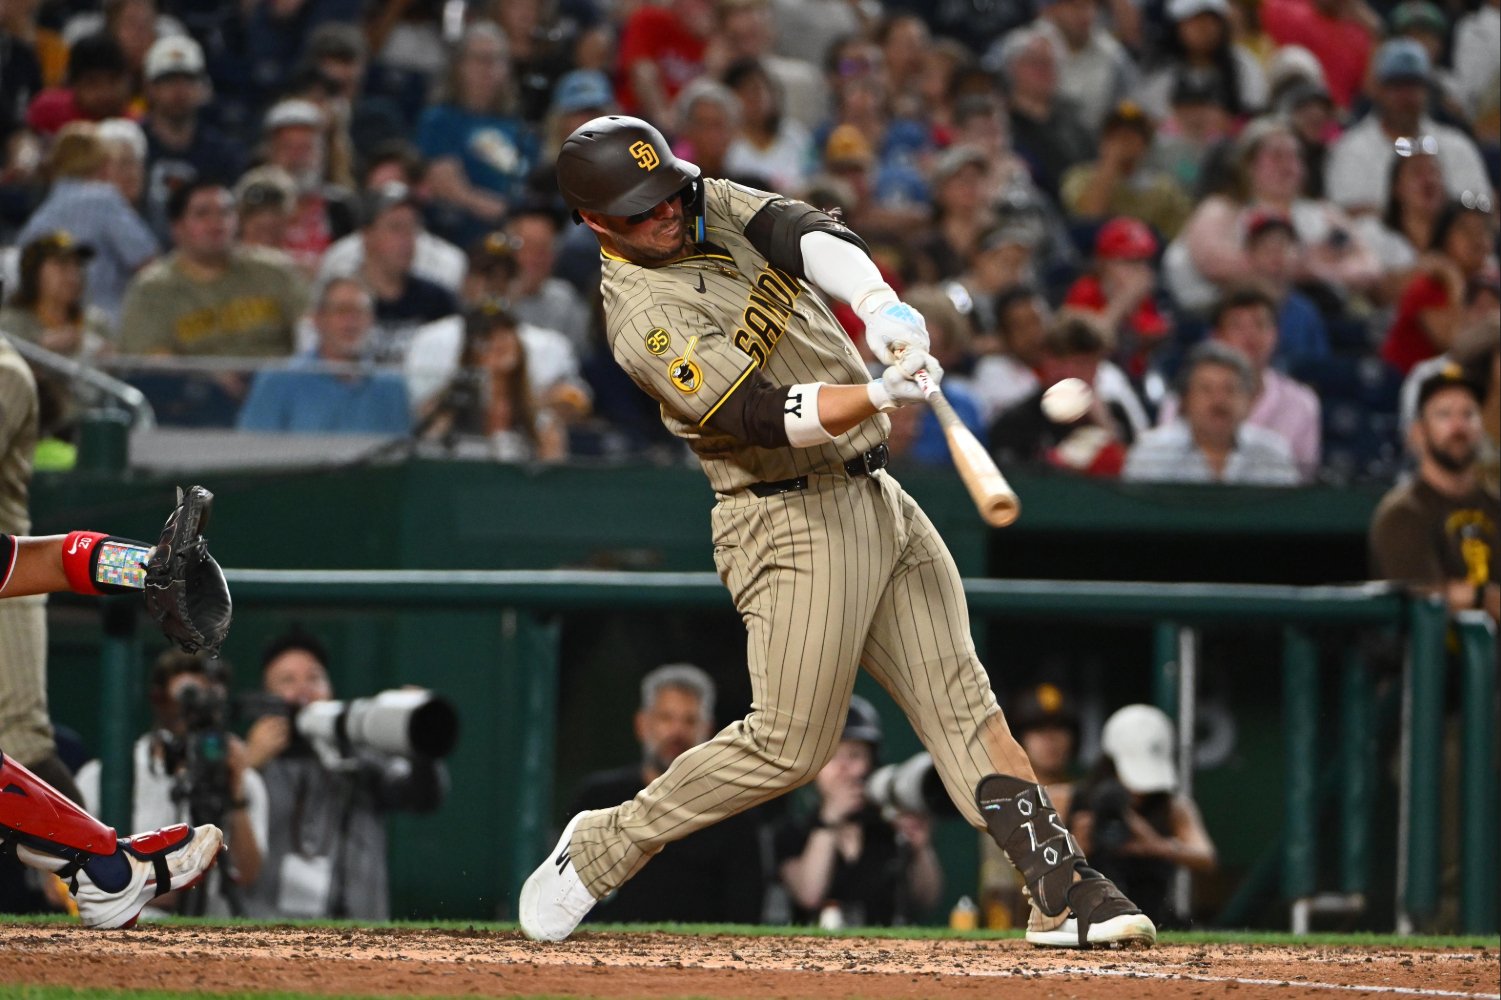 Where would the San Diego Padres be without Ty France? It’s impossible to know, but they almost certainly wouldn’t be 32-27. His 137 wRC+ leads the team among players with over 100 plate appearances, but that’s not really the interesting part. Unheralded players go through hot streaks all the time and carry their team in the process. While France has done that to some degree, it’s how he’s doing that which is noteworthy. Modern baseball hitting philosophy can be boiled down to three words: lift and pull. The reason for this is relatively simple. When you lift and pull, you’re more likely to hit the ball hard and in the air, which leads to extra bases. On top of that, if the pitcher knows you can do serious damage on contact, they pitch you more carefully, which means more balls and more walks. Functionally, lifting and pulling the ball leads to more power and on-base, which is kind of the name of the game. However, every hitter is different, and there is no one-size-fits-all approach, which brings us back to Ty France. France has gotten off to a torrid start by hitting the crap out of the ball. His 3.6% walk rate is scary, especially next to a 23.4% strikeout rate, but when you make that much contact and pair it with a 50% hard-hit rate, you can prosper. What is unusual is that France isn’t lifting and pulling his way to glory; in fact, he’s doing the opposite. On average, major leaguers pull 41% of their contact and go to the opposite field 23.7% of the time. By this metric, France doesn’t really stand out. He’s pulling 41.8% of his contact and going the other way at a 21.5% rate. However, that doesn’t mean he isn’t one of the most opposite-field-oriented hitters in baseball. On pulled contact, France is hitting fly balls 18.2% of the time, compared to the MLB average of 24.9%, and 58.8% of his opposite field contact are fly balls, against the MLB average of 62.20%. So, while France pulls the ball in the air much less than average, that’s still not really what makes him so interesting. Where you hit the ball is less important than how well you hit the ball. If you hit the ball hard enough, you have much more leeway with spray and launch angle, and this is where France has zigged where everyone else has zagged. France is currently sporting a 47.1% hard-hit rate on balls to the opposite field. If he had enough plate appearances to qualify, he’d rank third in that metric, behind only James Wood and Drake Baldwin, and even that undersells what he’s doing. On average, the MLB hard-hit rate is only 20.5% on balls to the opposite field, which France is more than doubling. When you factor in that France has a 29.4% line drive rate, on top of a 58.8% field fly ball rate, it’s easy to see why this unique profile is working. He’s lifting and crushing pitches to the opposite field in a way that few hitters have. Lift and pull isn’t actually about pulling the ball. In general, most hitters simply hit the ball harder to the pull side and struggle mightily to go the other way with authority. The thing is, France is not one of those hitters. He is elite at hitting the ball hard in the air to the opposite field, so why should he stop? Over the long haul, I doubt France will continue to run a wOBA of .368, as he has an xwOBA of .336, but that’d still constitute a successful bounce back after two mostly forgettable seasons. However, even if his production erodes, the first two months of the season have taught us a lesson: Hitting the ball hard, even the other way, is the key to hitting.
 -
The San Diego Padres improbably find themselves at 31-22 and keeping pace with the reigning champions in the National League West. It’s not that the Padres being one of the best teams in the league is wholly surprising; it is how they’ve gotten there that is. At the beginning of the season, if someone had told you that the Padres were challenging the Dodgers for the division title, your first thought would have likely been that Fernando Tatis Jr., Manny Machado, and Jackson Merrill had played at an MVP level, but you’d be wrong. The Padres have gotten here despite their star trio. Machado has a wRC+ of 76, Tatis clocks in at 77, and Merrill sits at a lowly 74. Thankfully, their defensive abilities have prevented them from being complete negatives, but that trio's underperformance is the primary reason the Padres own the league’s 27th-ranked offense by wRC+ at 90. While Tatis’ continued home run drought, despite excellent hard hit rates, is well chronicled, as is Machado’s perplexing brand of flaccid patience, Merrill’s struggles have flown a bit under the radar. Jackson Merrill, Future Star Bursting onto the scene as a 21-year-old rookie, Merrill looked like a future star and potential perennial MVP candidate. His 130 wRC+ as a rookie, while performing admirably in center field, a position he had never played as a prospect, led to an incredible 5.3 fWAR season, and saw him finish second in Rookie of the Year voting to Paul Skenes. It was enough to get the Padres to offer him a nine-year, $135 million extension that no one batted an eye at. Early in his career, the game plan for Merrill was simple. In possession of an incredibly variable swing, he could square the ball up anywhere in the zone for doubles damage. His blend of contact volume with above-average pop formed the foundation of an incredibly enticing profile. If either his plate discipline or power trended up, two traits that usually improve as a hitter matures, he would instantly become one of the game’s elite hitters, but after a slight backslide in his second season, he has completely fallen off in year three. So, what’s exactly befuddling such a talented hitter that he could go from being an All-Star as a rookie to one of the league’s worst non-catcher hitters? Well, he isn’t getting results in the heart of the zone. Finding Love in the Heart of the Zone The dirty secret of hitting is that the pitcher is in almost complete control. The vast majority of extra-base damage is done on pitches the pitcher would like back, and no one tries to throw balls. Even a mediocre fastball, if well executed, is going to give the best hitter fits, which is why the best hitters excel at taking advantage of mistakes, either through slugging pitches down the middle or spitting on pitches off the plate. Merrill isn’t blessed with an elite batting eye, but early in his career, it didn’t matter. He offered at pitches outside of the zone infrequently enough that it didn’t detract from his ability to square up balls in the zone. The trade-off as a hitter he was making made sense. Yes, he’d swing at some bad pitches, but he’d rarely fail to offer at ones he could drive. The result was a lower walk and strikeout rate, but a higher batting average and slugging percentage. Unfortunately, the entire operation has gone backwards this season. Through 50 games and more than 200 plate appearances, Merrill’s contact ability has continued to erode, and he’s offering at pitches outside of the zone more than ever. However, that isn’t what’s really troubling him. Plenty of hitters can succeed with this approach as long as they punish the mistakes in the heart of the zone. The problem is that Merrill hasn’t done enough with those crushable mistakes. Compared to 2025, Merrill has seen a concerning drop in his production in the dead center of the strike zone. *Stats as of the week of May 25 It’s still early, but Merrill is whiffing more and hitting for a worse average and slugging percentage on pitches down the middle. If he were still using the same approach as his rookie season, his overall production would probably still be fine, but because his approach has shifted to take advantage of those exact pitches at the cost of plate coverage, it’s a serious problem. Now, it would be fine if Merrill’s plate discipline and in-zone contact figures declined if it came with a corresponding bump in production right down the middle, but right now, everything is coming up snake eyes. However, there is some good news. Process Over Results in the Heart of the Zone Whether or not you think Merrill changing his approach from being a plate coverage monster to a home run-seeking slugger is a positive development, it appears to be the choice he has made. The good news is that while his surface numbers in the heart of the plate have declined, the underlying batted ball data suggest he has been incredibly unlucky. By and large, Merrill’s new approach has been working from a process standpoint. He has sacrificed his ability to cover the entire plate to improve his contact in the heart of the zone. However, one of the problems when you make this decision is that you’re at greater mercy of batted ball luck and the unknowable location of each pitch. A two-percent drop in pitches down the middle doesn’t seem like much, but for a hitter it’s massive. Merrill has swung at 92% of pitches down the middle this season and made contact at an 84% clip. This season, he has faced 797 pitches. At an 8% dead center rate, that’d equal 63.76 total pitches, but at 6%, it drops to 47.82. That’s 15.94, let’s say 16, fewer pitches where Merrill would swing 92% of the time, equaling 14.72 more swings and 12.36 more times where he makes contact. Considering his expected slugging is 0.943, that’s an incredible loss in potential production. In all likelihood, Merrill will see his metrics regress towards his expected stats in the heart of the zone, and it’ll pull his offensive production out of the red. While we can expect better days for Merrill ahead, it’s another matter if this evolution was the right one to take. He’s walking and striking out more because pitchers are throwing him fewer strikes, even though he’s chasing more than ever. On pitches not down the middle, his underlying production has mostly declined. While you can get the most bang for your buck on dead-red fastballs, Merrill’s superpower was his ability to get plenty of bang on pitches throughout the zone. This new approach will probably lead to Merrill being far streakier, as we’ve seen in the bad way, to start the season. Now, it’s not like Merrill has to abandon his new approach for it to be worthwhile, but he does need to refine it. If he can rein in the chase and continue to aggressively hunt middle-middle pitches, he’ll be fine. But if the chase is the cost of doing business, he might be better off covering the whole plate. The good news for the Padres is that they’re well above .500 and better days are likely ahead for their youngest star. His new approach might not be optimal long-term, but he has executed it far better than his current production would suggest. As the summer starts to heat up and he gets an unusually high number of middle-middle pitches, don’t be surprised if he goes on a surge, but also don’t be surprised when he comes crashing back to Earth. Merrill is still a good hitter, but he is fundamentally a different one than the star we knew. View full article
-
Jackson Merrill Hasn't Found Love in the Heart of the Zone
N.B. Lindberg posted an article in Padres
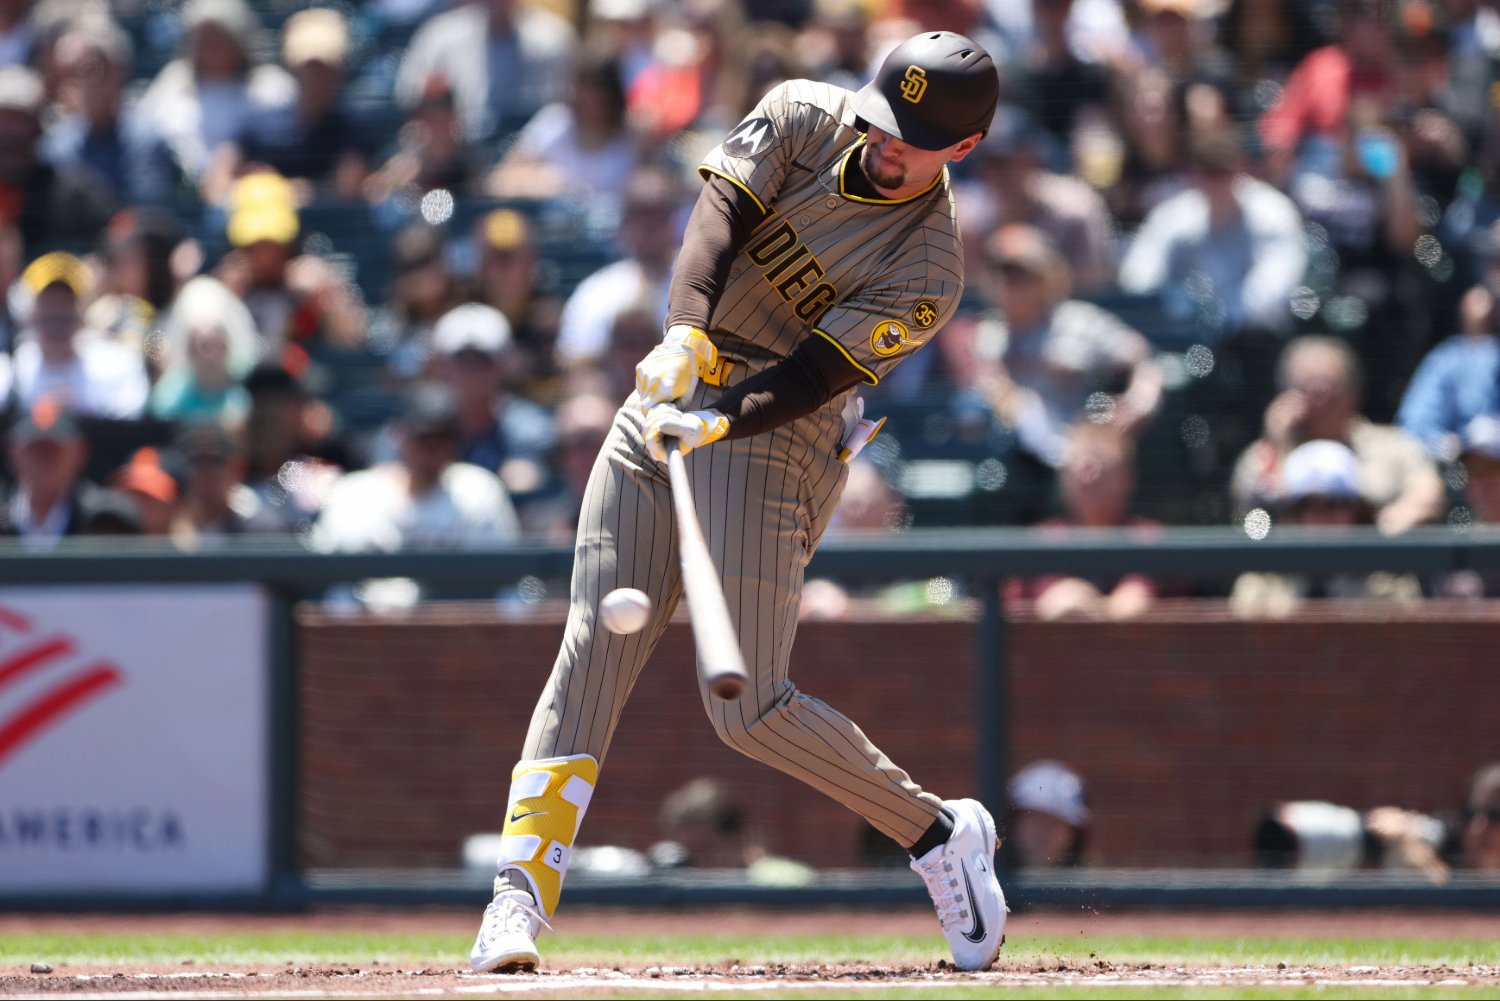 The San Diego Padres improbably find themselves at 31-22 and keeping pace with the reigning champions in the National League West. It’s not that the Padres being one of the best teams in the league is wholly surprising; it is how they’ve gotten there that is. At the beginning of the season, if someone had told you that the Padres were challenging the Dodgers for the division title, your first thought would have likely been that Fernando Tatis Jr., Manny Machado, and Jackson Merrill had played at an MVP level, but you’d be wrong. The Padres have gotten here despite their star trio. Machado has a wRC+ of 76, Tatis clocks in at 77, and Merrill sits at a lowly 74. Thankfully, their defensive abilities have prevented them from being complete negatives, but that trio's underperformance is the primary reason the Padres own the league’s 27th-ranked offense by wRC+ at 90. While Tatis’ continued home run drought, despite excellent hard hit rates, is well chronicled, as is Machado’s perplexing brand of flaccid patience, Merrill’s struggles have flown a bit under the radar. Jackson Merrill, Future Star Bursting onto the scene as a 21-year-old rookie, Merrill looked like a future star and potential perennial MVP candidate. His 130 wRC+ as a rookie, while performing admirably in center field, a position he had never played as a prospect, led to an incredible 5.3 fWAR season, and saw him finish second in Rookie of the Year voting to Paul Skenes. It was enough to get the Padres to offer him a nine-year, $135 million extension that no one batted an eye at. Early in his career, the game plan for Merrill was simple. In possession of an incredibly variable swing, he could square the ball up anywhere in the zone for doubles damage. His blend of contact volume with above-average pop formed the foundation of an incredibly enticing profile. If either his plate discipline or power trended up, two traits that usually improve as a hitter matures, he would instantly become one of the game’s elite hitters, but after a slight backslide in his second season, he has completely fallen off in year three. So, what’s exactly befuddling such a talented hitter that he could go from being an All-Star as a rookie to one of the league’s worst non-catcher hitters? Well, he isn’t getting results in the heart of the zone. Finding Love in the Heart of the Zone The dirty secret of hitting is that the pitcher is in almost complete control. The vast majority of extra-base damage is done on pitches the pitcher would like back, and no one tries to throw balls. Even a mediocre fastball, if well executed, is going to give the best hitter fits, which is why the best hitters excel at taking advantage of mistakes, either through slugging pitches down the middle or spitting on pitches off the plate. Merrill isn’t blessed with an elite batting eye, but early in his career, it didn’t matter. He offered at pitches outside of the zone infrequently enough that it didn’t detract from his ability to square up balls in the zone. The trade-off as a hitter he was making made sense. Yes, he’d swing at some bad pitches, but he’d rarely fail to offer at ones he could drive. The result was a lower walk and strikeout rate, but a higher batting average and slugging percentage. Unfortunately, the entire operation has gone backwards this season. Through 50 games and more than 200 plate appearances, Merrill’s contact ability has continued to erode, and he’s offering at pitches outside of the zone more than ever. However, that isn’t what’s really troubling him. Plenty of hitters can succeed with this approach as long as they punish the mistakes in the heart of the zone. The problem is that Merrill hasn’t done enough with those crushable mistakes. Compared to 2025, Merrill has seen a concerning drop in his production in the dead center of the strike zone. *Stats as of the week of May 25 It’s still early, but Merrill is whiffing more and hitting for a worse average and slugging percentage on pitches down the middle. If he were still using the same approach as his rookie season, his overall production would probably still be fine, but because his approach has shifted to take advantage of those exact pitches at the cost of plate coverage, it’s a serious problem. Now, it would be fine if Merrill’s plate discipline and in-zone contact figures declined if it came with a corresponding bump in production right down the middle, but right now, everything is coming up snake eyes. However, there is some good news. Process Over Results in the Heart of the Zone Whether or not you think Merrill changing his approach from being a plate coverage monster to a home run-seeking slugger is a positive development, it appears to be the choice he has made. The good news is that while his surface numbers in the heart of the plate have declined, the underlying batted ball data suggest he has been incredibly unlucky. By and large, Merrill’s new approach has been working from a process standpoint. He has sacrificed his ability to cover the entire plate to improve his contact in the heart of the zone. However, one of the problems when you make this decision is that you’re at greater mercy of batted ball luck and the unknowable location of each pitch. A two-percent drop in pitches down the middle doesn’t seem like much, but for a hitter it’s massive. Merrill has swung at 92% of pitches down the middle this season and made contact at an 84% clip. This season, he has faced 797 pitches. At an 8% dead center rate, that’d equal 63.76 total pitches, but at 6%, it drops to 47.82. That’s 15.94, let’s say 16, fewer pitches where Merrill would swing 92% of the time, equaling 14.72 more swings and 12.36 more times where he makes contact. Considering his expected slugging is 0.943, that’s an incredible loss in potential production. In all likelihood, Merrill will see his metrics regress towards his expected stats in the heart of the zone, and it’ll pull his offensive production out of the red. While we can expect better days for Merrill ahead, it’s another matter if this evolution was the right one to take. He’s walking and striking out more because pitchers are throwing him fewer strikes, even though he’s chasing more than ever. On pitches not down the middle, his underlying production has mostly declined. While you can get the most bang for your buck on dead-red fastballs, Merrill’s superpower was his ability to get plenty of bang on pitches throughout the zone. This new approach will probably lead to Merrill being far streakier, as we’ve seen in the bad way, to start the season. Now, it’s not like Merrill has to abandon his new approach for it to be worthwhile, but he does need to refine it. If he can rein in the chase and continue to aggressively hunt middle-middle pitches, he’ll be fine. But if the chase is the cost of doing business, he might be better off covering the whole plate. The good news for the Padres is that they’re well above .500 and better days are likely ahead for their youngest star. His new approach might not be optimal long-term, but he has executed it far better than his current production would suggest. As the summer starts to heat up and he gets an unusually high number of middle-middle pitches, don’t be surprised if he goes on a surge, but also don’t be surprised when he comes crashing back to Earth. Merrill is still a good hitter, but he is fundamentally a different one than the star we knew.
 -
Very few players excel at everything. Sure, there are the Shohei Ohtanis and Bobby Witt Jr.s of the world who seemingly do it all, but the key to success for most players is that they do one thing extremely well and tread water everywhere else. Ramon Laureano was one of those players, and he still kind of is, except he is doing it in the complete opposite way as before. After parts of nine seasons in the bigs and at 31 years old, there isn’t a ton of mystery as to what makes Laureano tick. He plays solid outfield defense, holds his own against right-handed pitching, and crushes lefties. Just about every team would sign up for his career wRC+ of 108 against right-handed pitching and 123 wRC+ against lefties from a guy who can fake it in center for a game or two. It’s why the San Diego Padres traded for him last year, and he more than lived up to the billing in 2025, posting a wRC+ of 139 against left-handed pitching and a career-best 137 against right-handers. Heading into 2026, the expectation was that Laureano would cool off a tad against right-handers but would continue to mash lefties. And while he has cooled off a tad against same-handed pitching, he has cratered when he has the platoon advantage, just like no one expected. It’s still early, but heading into a mid-May clash with the Milwaukee Brewers, Laureano has a wRC+ of 113 against right-handed pitching and a wRC+ of 45 against lefties. While Laureano has had extended stretches where he has hit right-handed pitching well, the last time he finished a season with a wRC+ below 100 against left-handed pitching was the truncated 2020 season. If you exclude 2020 for the obvious reason that it was 60 games long, the lowest full-season mark of his career against left-handers is 108. Simply put, a wRC+ of 45 is beyond uncharted territory. Ramon Laureano Career Platoon Splits *Stats as of May 12, 2026 Early in his career, Laureano did hit right-handed pitching better than left-handed pitching, but he was still wildly productive against lefties. However, starting in 2021, he began showing more conventional platoon splits, but the degree to which it has flipped this season is jarring. The easy answer to his struggles is that he is running a BABIP of .250 against lefties, against a career figure of .338, but there’s far more to it than just bad luck. Laureano is struggling against left-handed pitching because he hasn’t been able to turn on it. Stop me if you’ve heard this before, but Laureano’s offensive profile is driven by power. He doesn’t possess monster bat speed or exit velocities, but when he does make contact, it’s usually hard, in the air, and to the pull side. For his career, he has a pulled air rate of 19.4%, against the league average of 16.7%, and it was 21.8% in 2025. Unfortunately, in 2026, his pull air rate is down to a near career-low of 15.9%, and it has come largely against left-handed pitching. For his career, Laureano owns a fly ball rate of 37.1% and a pull rate of 43.6%. Against right-handed pitching, his career fly ball rate is 38.5% with a pull rate of 43.3%, and when facing left-handed pitching, his fly ball rate clocks in at 33.9% with a pull rate of 44.3%. In 2026, his fly-ball rate against left-handed pitching is up to 45%, but his pull rate is down to 30%. That's a lot of numbers to throw at you, but the point of the data is thus: Throughout his career, the more he has lifted the ball against left-handed pitching, the worse the results have been (-0.83 linear correlation to wRC+), but the more he has pulled the ball, the better they have been (0.836 linear correlation to wRC+). With that in mind, his 2026 spray map shows exactly why he has cratered. Most of his elevated contact has been to right field, while the vast majority of his pulled contact has been on the ground. This isn’t an unusual split, but the trade-off for pulled grounders needs to be elevated-and-celebrated pulled contact. To be a successful hitter with Laureano’s raw thump, you need to lift and pull, not lift or pull. It’s difficult to parse exactly why Laureano has struggled to turn on left-handed pitching, but I doubt that he has suddenly become Derek Zoolander. It’s very likely that this is a small sample quirk, which has been exacerbated by him facing better-than-average left-handed pitching. He has already faced Tarik Skubal, Framber Valdez, Ranger Suarez, Aroldis Chapman, and Gregory Soto, among others. Upon pulling the data, the average left-hander he had faced up to that point had a 3.17 ERA and 3.44 FIP, against league averages of 3.82 and 3.97. At the end of the day, Laureano’s struggles against left-handers have only come in 32 plate appearances. I trust his track record of pulling the ball with authority when he has the platoon advantage more than what he has done in the early going. Now, if this continues, it’ll be worth examining, but we’ll also have more information to really figure things out. And considering how well he has hit right-handers, there’s a good chance he goes from being a league-average bat (99 wRC+) to the middle of the order thumper he was last season (138 wRC+), which the Padres could desperately use. View full article
