


Yirsandy Rodríguez
-
Posts
70 -
Joined
-
Last visited
Content Type
Profiles
San Diego Padres Videos
2026 San Diego Padres Top Prospects Ranking
San Diego Padres Free Agent & Trade Rumors, Notes, & Tidbits
Guides & Resources
2025 San Diego Padres Draft Pick Tracker
News
2026 San Diego Padres Draft Tracker: Picks & Bonuses
Forums
Blogs
Events
Store
Downloads
Gallery
Everything posted by Yirsandy Rodríguez
-
 The biggest thing that made Xander Bogaerts a sought-after shortstop when he became a free agent was his ability to impact the game as an all-around elite player. When he arrived in San Diego, he met those standards in 2023, but since then, his offense has been declining until it hit rock bottom this season. The regressions in his game have been limited to the offense, as he remains an above-average fielder and a pretty good baserunner. However, Bogaerts fell to the 24th percentile in batting value, the worst of his career with the Padres, and finished with a batting average of just .231 and a .344 slugging percentage. It is impossible not to think about his decline when seeing how far he fell short of his usual numbers: he hit .292 with a .458 slugging percentage in 10 seasons with Boston, compared with .272 and .407 between 2023 and 2025, since he arrived in San Diego. As you can see here, the problem is not his bat speed or Bogaerts’ ability to make contact and put the ball in play. In fact, he finished 2026 with his highest walk rate (12.7%), so his plate discipline helped prevent his entire offense from ending up in an even worse abyss. That said, this is my theory about what caused Bogaerts’ chaos at the plate: his inability to hit pitches that were not fastballs. Pitch Category Pitch % PA HR K% BA xBA OBP xOBP SLG xSLG xwOBA BABIP Whiff% EV (MPH) Hard Hit% Barrel/BBE% Bat Speed Fastballs 54.8% 372 9 11.8% .261 .276 .371 .386 .392 .429 .363 .278 14.3% 91.2 45.8% 6.6% 70.6 Non-Fastballs 33.0% 169 3 25.4% .204 .220 .290 .306 .293 .321 .284 .260 32.3% 86.7 35.5% 3.7% 68.8 Although that BABIP mark remained at a similar level, the differences in contact quality were notable, with significant drops in xBA, xSLG, Barrel/BBE%, and whiff%. Of those 169 plate appearances that ended with a pitch type that wasn't a heater, he recorded a high strikeout rate of 25.4% and another 30.7% ended in ground balls or pop-ups that averaged just a .195 xwOBA. Unlike what happened against fastballs, Bogaerts’ swing failed to do damage in the inner zones, where he hit just .221 xBA against middle and middle-high pitches. His highest average in the lower and outside edges, where pitches were located most often in decisive counts, was .224 in the lower zone over the plate. Here is Bogaerts’ spray-chart on the non-fastballs he put in play. The hot zones were scarce, and most were located toward the left side of the infield. That decline in his ability to produce hard-hit balls was the most concerning drop that marked Bogaerts’ 2026 season and the biggest challenge he has ahead of him during the remaining seven years of his contract with the Padres. View full article
 -
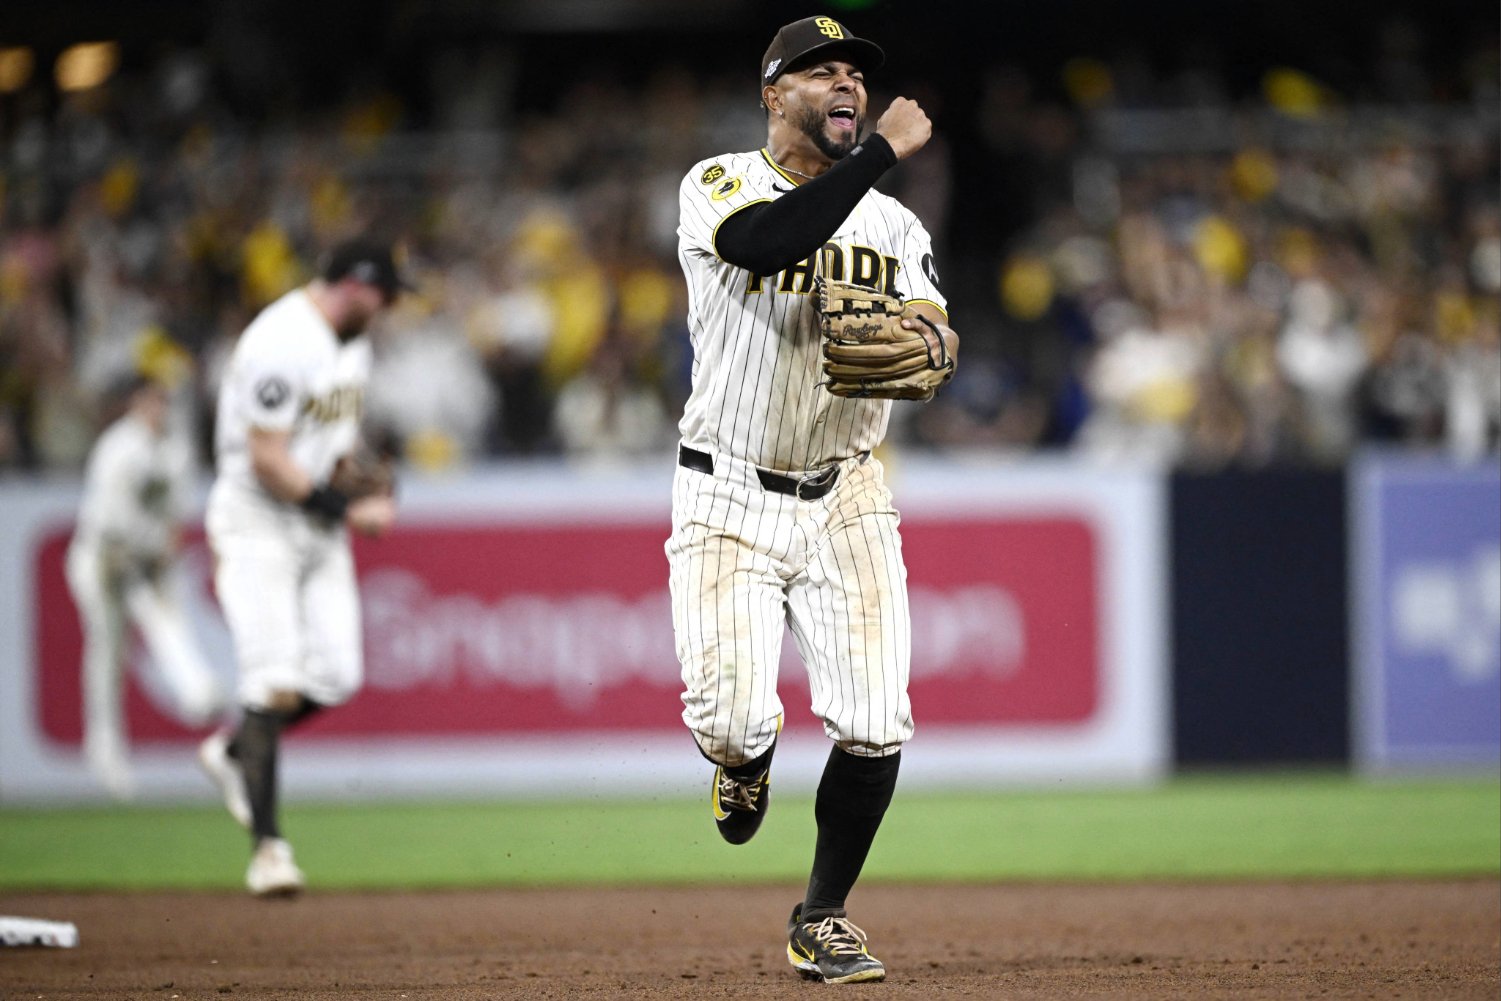 The biggest thing that made Xander Bogaerts a sought-after shortstop when he became a free agent was his ability to impact the game as an all-around elite player. When he arrived in San Diego, he met those standards in 2023, but since then, his offense has been declining until it hit rock bottom this season. The regressions in his game have been limited to the offense, as he remains an above-average fielder and a pretty good baserunner. However, Bogaerts fell to the 24th percentile in batting value, the worst of his career with the Padres, and finished with a batting average of just .231 and a .344 slugging percentage. It is impossible not to think about his decline when seeing how far he fell short of his usual numbers: he hit .292 with a .458 slugging percentage in 10 seasons with Boston, compared with .272 and .407 between 2023 and 2025, since he arrived in San Diego. As you can see here, the problem is not his bat speed or Bogaerts’ ability to make contact and put the ball in play. In fact, he finished 2026 with his highest walk rate (12.7%), so his plate discipline helped prevent his entire offense from ending up in an even worse abyss. That said, this is my theory about what caused Bogaerts’ chaos at the plate: his inability to hit pitches that were not fastballs. Pitch Category Pitch % PA HR K% BA xBA OBP xOBP SLG xSLG xwOBA BABIP Whiff% EV (MPH) Hard Hit% Barrel/BBE% Bat Speed Fastballs 54.8% 372 9 11.8% .261 .276 .371 .386 .392 .429 .363 .278 14.3% 91.2 45.8% 6.6% 70.6 Non-Fastballs 33.0% 169 3 25.4% .204 .220 .290 .306 .293 .321 .284 .260 32.3% 86.7 35.5% 3.7% 68.8 Although that BABIP mark remained at a similar level, the differences in contact quality were notable, with significant drops in xBA, xSLG, Barrel/BBE%, and whiff%. Of those 169 plate appearances that ended with a pitch type that wasn't a heater, he recorded a high strikeout rate of 25.4% and another 30.7% ended in ground balls or pop-ups that averaged just a .195 xwOBA. Unlike what happened against fastballs, Bogaerts’ swing failed to do damage in the inner zones, where he hit just .221 xBA against middle and middle-high pitches. His highest average in the lower and outside edges, where pitches were located most often in decisive counts, was .224 in the lower zone over the plate. Here is Bogaerts’ spray-chart on the non-fastballs he put in play. The hot zones were scarce, and most were located toward the left side of the infield. That decline in his ability to produce hard-hit balls was the most concerning drop that marked Bogaerts’ 2026 season and the biggest challenge he has ahead of him during the remaining seven years of his contract with the Padres.
 -
It was another disappointing finish for the San Diego Padres, but we also have to recognize that they were eliminated by the best team in baseball throughout the entire season: the Milwaukee Brewers. Everything came down to a four-game series dominated by pitching from start to finish. No winning team scored more than four runs and, with the exception of Game 4, every game ended by a one-run margin. So, the opportunity to turn the series around was there the entire time. The Padres recorded 145 plate appearances and, in 41.3% of them, their hitters came to the plate with the score tied or trailing by just one run. Unfortunately, the Friars were only able to change the score in three of the 19 occasions when it had runners in scoring position. In the end, the key hit didn’t come in most of those opportunities and, in two of them, the baseball gods were not on their side. Before the postseason, I set out to investigate what kind of shape most of San Diego’s starting hitters were in when they arrived at the playoffs. In several cases, they entered the postseason in the best form of their season; in others, they simply never found their best version. Here, I take a look at some of the moments that defined each hitter before and during the postseason. Austin Hays His out-of-zone contact rate fell from 55% in September to 33.3% in the postseason, which led to an increase in his strikeout rate from 22.6% to 30%. Hays had a good pinch-hit at-bat for Jake Cronenworth in the top of the eighth inning of Game 1, when he hit a fly ball against left-hander DL Hall with runners on first and second and one out. Samad Taylor took advantage and advanced to third, but Fernando Tatis Jr. then struck out against Trevor Megill. Dustin Harris Despite recording just a .188 xwOBA in the NLDS, Harris made an interesting adjustment by lowering his swing rate on pitches outside the zone from 32.5% to 15.8%. At the same time, however, his contact rate fell from 65.3% to 50%. On the other hand, his decline in production also coincided with a drop in his BABIP, which went from a surprising .328 in the final month of the regular season to just .200 in the NLDS. Ethan Salas His talent is undeniable, but his .737 OPS in September fell to .325 over his 10 postseason plate appearances. He also finished with a 37.5% strikeout rate, the highest of anyone on the roster. Fernando Tatis Jr. Before reaching the postseason, Tatis was going through one of the best stretches of his entire campaign, so it was inevitable that expectations would be high. He hit .337/.413/.652, with a 1.066 OPS and 193 wRC+ in September, but then fell to .167/.231/.417 and 78 wRC+ in the postseason. In 17 of his 18 plate appearances against the Brewers, Tatis came to the plate with the score close. He finished 1-for-7 with two strikeouts in tied-game situations, including both of his leadoff at-bats. His only two productive plate appearances were the RBI groundout against Dustin May that gave the Padres a 1-0 lead in the third inning of Game 3, and the home run against Robert Gasser that tied Game 4 in the third inning. Gavin Sheets He won’t only be remembered for striking out for the final out of the NLDS against Trevor Megill’s knuckle curveball, but also because he had fallen into a terrible slump in September for the second consecutive year. In 2025, he finished with a 61 wRC+; this year, his OPS fell to just .333 and his wRC+ to -10. Jackson Merrill He's arrived to the playoffs in peak form in recent years, with 156 and 152 wRC+ marks in September 2025 and 2026, respectively. But this time, he couldn’t shine and was limited to a .176/.176/.176 line against the Brewers. Game 1 was his biggest test, when he had three key opportunities against Aaron Ashby, DL Hall and Trevor Megill in the fifth, seventh and ninth innings, respectively. All three came with two outs. Against Ashby, he failed with a fly ball to center field, with runners on second and third and the game tied 2-2. He then faced Hall with the bases loaded and failed again with a fly ball to left field against a cutter high and away. Later, in the ninth, he hit a line-drive out to right field against a 99 mph fastball from Megill for the final out of the game. He finished 1-for-7 against Milwaukee’s group of left-handed relievers: Ashby, Hall, and JoJo Romero. Jake Cronenworth After struggling for much of the first half of the season and spending time on the injured list, Cronenworth recorded a 119 wRC+ in July. He then fell to 75 in August, but adjusted his swing again in September, when he posted a .418 slugging percentage, his highest in any month of the entire season. However, he became anxious at the plate again, and his swing rate on pitches outside the zone rose from 26.4% to 39.3%. The only two hits he recorded in the NLDS came against left-handed pitchers: a single against DL Hall and the solo home run on the first pitch of the fifth inning in Game 3 against JoJo Romero, which turned out to be one of the key hits that allowed the Padres to avoid the sweep. That home run was the hit that added the most win probability for the Padres (0.14) from a batter in the entire NLDS. Manny Machado It’s inevitable to mention one of the hits that could have changed the course of the postseason for the Padres. When Machado hit that deep fly ball to center field in Game 4 and Garrett Mitchell caught it, it felt as if the game had ended right there. No matter how much Padres fans tried not to lose hope, the team couldn’t recover, and that colossal catch by Mitchell was the final attempt at a comeback. If there was one key to the Brewers’ pitching, it was preventing Machado from finding runners on base frequently. In nine of his 17 plate appearances, he found the bases empty, and he finished 1-for-6, with three walks and a double in those at-bats. He went 1-for-2 with runners in scoring position (RISP), and the only run he drove in came on a single against Dustin May in the third inning of Game 3. Luis Campusano Do you remember his 156 wRC+ in July? That version of Campusano didn’t make it past August, when he recorded a 112 wRC+. In September and October 2026, he hit .215/.292/.369, with an 88 wRC+ in 72 plate appearances. Although he improved his OBP to .357 over his 14 postseason plate appearances, his contact rate against pitches in the zone fell considerably, from 83.9% to 70.6%. That regression mattered, since Campusano had runners on base in five of his 10 at-bats against the Brewers in the NLDS. His big at-bat will be remembered: in the second inning of Game 1, he hit a single against a cutter from Jacob Misiorowski that came right down the middle of the zone, putting the Padres ahead 1-0. However, he didn’t drive in another run in his remaining nine plate appearances. In each of them, he had the chance to change the score, since he always came to the plate with the game tied or with a one-run difference, whether the Padres were ahead or behind. Samad Taylor Contact ability, one of the elements that drove Taylor’s at-bats for much of the year, suffered its biggest regression in the postseason: his out-of-zone swing rate increased from 30.6% to 46.7%. He didn’t draw any walks, and his strikeout rate jumped from 21.1% to 40%. Yes, I haven’t forgotten his reaction when he struck out looking at Ashby’s curveball for the third out of the seventh inning in Game 4. Ty France All of his months were solid, featuring at least a 123 wRC+, and he finished September with an impressive 140 mark. His bat made a difference for the Padres, and it’s very likely that he will receive a contract offer, since he will be a free agent in a matter of weeks. In any case, people will talk for a long time about the fly ball he hit off the roof of American Family Field in Game 1. Statcast projected it as a potential home run in one of the 30 ballparks, with a chance to become a home run only at Daikin Park. From Game 2 onward, France finished 2-for-10 and drove in just one run. Xander Bogaerts You may find it surprising, but Bogaerts hit only two balls that clearly got past the infield against the Brewers. Both were line drives: a single against Antonio Senzatela, with the bases empty and two outs in the sixth inning of Game 3, and a line-drive out to right field against Robert Gasser. Bogaerts had finished the Wild Card Series against the Chicago Cubs 4-for-8, with a double, a home run and two RBIs, but the Brewers limited him to a puzzling .154/.267/.154 slash line, with just a 32 wRC+ in 15 plate appearances. View full article
-
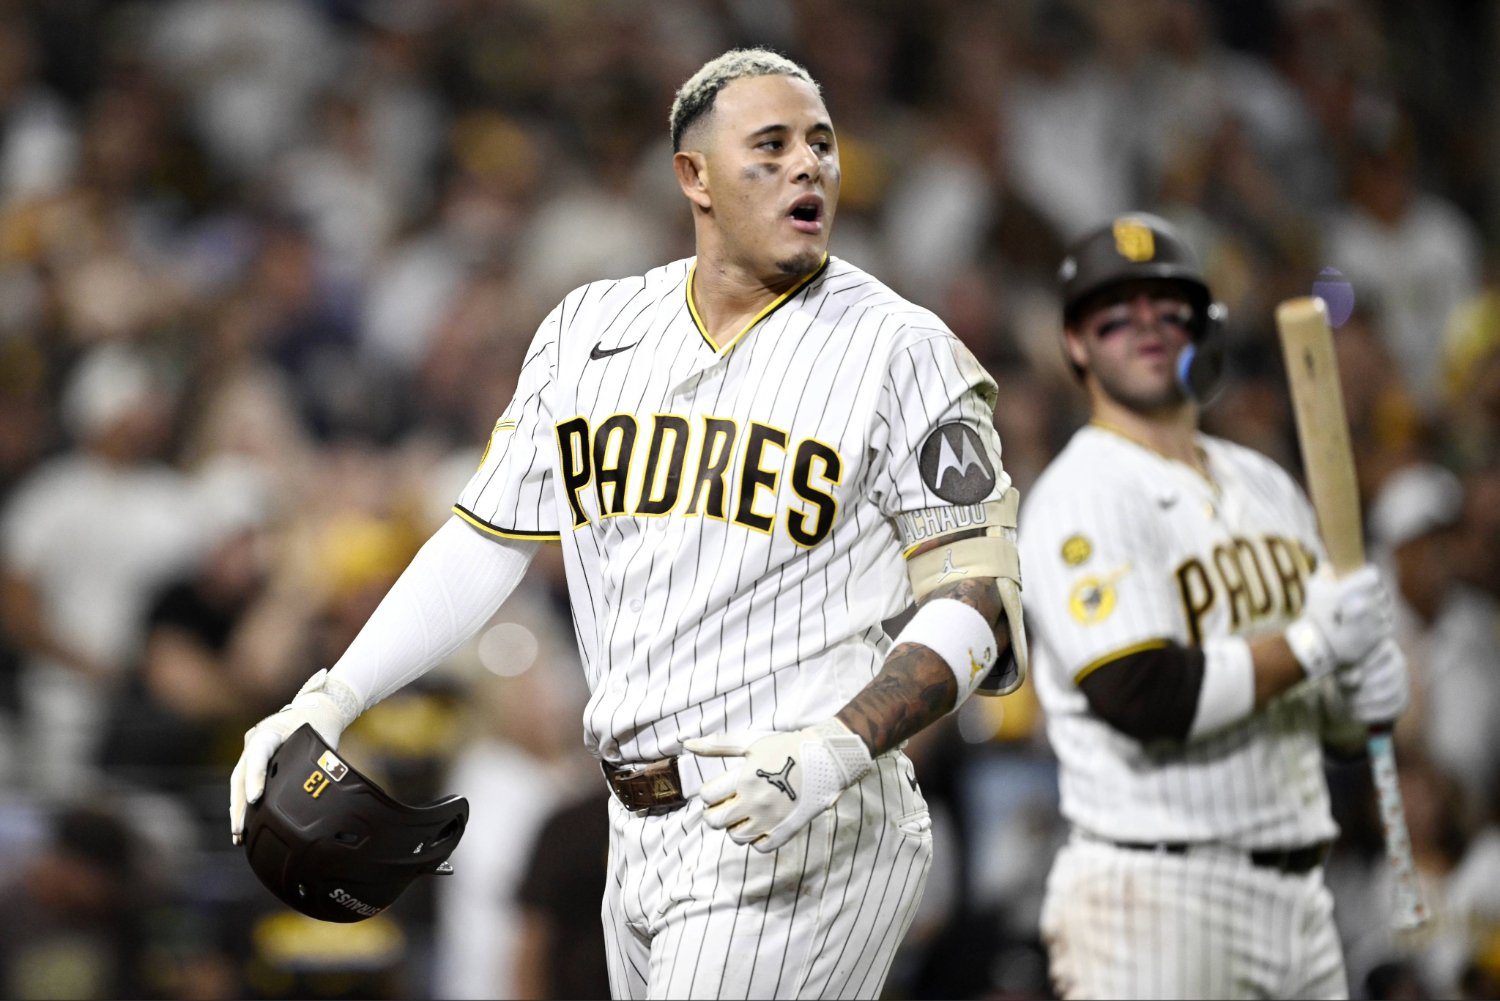 It was another disappointing finish for the San Diego Padres, but we also have to recognize that they were eliminated by the best team in baseball throughout the entire season: the Milwaukee Brewers. Everything came down to a four-game series dominated by pitching from start to finish. No winning team scored more than four runs and, with the exception of Game 4, every game ended by a one-run margin. So, the opportunity to turn the series around was there the entire time. The Padres recorded 145 plate appearances and, in 41.3% of them, their hitters came to the plate with the score tied or trailing by just one run. Unfortunately, the Friars were only able to change the score in three of the 19 occasions when it had runners in scoring position. In the end, the key hit didn’t come in most of those opportunities and, in two of them, the baseball gods were not on their side. Before the postseason, I set out to investigate what kind of shape most of San Diego’s starting hitters were in when they arrived at the playoffs. In several cases, they entered the postseason in the best form of their season; in others, they simply never found their best version. Here, I take a look at some of the moments that defined each hitter before and during the postseason. Austin Hays His out-of-zone contact rate fell from 55% in September to 33.3% in the postseason, which led to an increase in his strikeout rate from 22.6% to 30%. Hays had a good pinch-hit at-bat for Jake Cronenworth in the top of the eighth inning of Game 1, when he hit a fly ball against left-hander DL Hall with runners on first and second and one out. Samad Taylor took advantage and advanced to third, but Fernando Tatis Jr. then struck out against Trevor Megill. Dustin Harris Despite recording just a .188 xwOBA in the NLDS, Harris made an interesting adjustment by lowering his swing rate on pitches outside the zone from 32.5% to 15.8%. At the same time, however, his contact rate fell from 65.3% to 50%. On the other hand, his decline in production also coincided with a drop in his BABIP, which went from a surprising .328 in the final month of the regular season to just .200 in the NLDS. Ethan Salas His talent is undeniable, but his .737 OPS in September fell to .325 over his 10 postseason plate appearances. He also finished with a 37.5% strikeout rate, the highest of anyone on the roster. Fernando Tatis Jr. Before reaching the postseason, Tatis was going through one of the best stretches of his entire campaign, so it was inevitable that expectations would be high. He hit .337/.413/.652, with a 1.066 OPS and 193 wRC+ in September, but then fell to .167/.231/.417 and 78 wRC+ in the postseason. In 17 of his 18 plate appearances against the Brewers, Tatis came to the plate with the score close. He finished 1-for-7 with two strikeouts in tied-game situations, including both of his leadoff at-bats. His only two productive plate appearances were the RBI groundout against Dustin May that gave the Padres a 1-0 lead in the third inning of Game 3, and the home run against Robert Gasser that tied Game 4 in the third inning. Gavin Sheets He won’t only be remembered for striking out for the final out of the NLDS against Trevor Megill’s knuckle curveball, but also because he had fallen into a terrible slump in September for the second consecutive year. In 2025, he finished with a 61 wRC+; this year, his OPS fell to just .333 and his wRC+ to -10. Jackson Merrill He's arrived to the playoffs in peak form in recent years, with 156 and 152 wRC+ marks in September 2025 and 2026, respectively. But this time, he couldn’t shine and was limited to a .176/.176/.176 line against the Brewers. Game 1 was his biggest test, when he had three key opportunities against Aaron Ashby, DL Hall and Trevor Megill in the fifth, seventh and ninth innings, respectively. All three came with two outs. Against Ashby, he failed with a fly ball to center field, with runners on second and third and the game tied 2-2. He then faced Hall with the bases loaded and failed again with a fly ball to left field against a cutter high and away. Later, in the ninth, he hit a line-drive out to right field against a 99 mph fastball from Megill for the final out of the game. He finished 1-for-7 against Milwaukee’s group of left-handed relievers: Ashby, Hall, and JoJo Romero. Jake Cronenworth After struggling for much of the first half of the season and spending time on the injured list, Cronenworth recorded a 119 wRC+ in July. He then fell to 75 in August, but adjusted his swing again in September, when he posted a .418 slugging percentage, his highest in any month of the entire season. However, he became anxious at the plate again, and his swing rate on pitches outside the zone rose from 26.4% to 39.3%. The only two hits he recorded in the NLDS came against left-handed pitchers: a single against DL Hall and the solo home run on the first pitch of the fifth inning in Game 3 against JoJo Romero, which turned out to be one of the key hits that allowed the Padres to avoid the sweep. That home run was the hit that added the most win probability for the Padres (0.14) from a batter in the entire NLDS. Manny Machado It’s inevitable to mention one of the hits that could have changed the course of the postseason for the Padres. When Machado hit that deep fly ball to center field in Game 4 and Garrett Mitchell caught it, it felt as if the game had ended right there. No matter how much Padres fans tried not to lose hope, the team couldn’t recover, and that colossal catch by Mitchell was the final attempt at a comeback. If there was one key to the Brewers’ pitching, it was preventing Machado from finding runners on base frequently. In nine of his 17 plate appearances, he found the bases empty, and he finished 1-for-6, with three walks and a double in those at-bats. He went 1-for-2 with runners in scoring position (RISP), and the only run he drove in came on a single against Dustin May in the third inning of Game 3. Luis Campusano Do you remember his 156 wRC+ in July? That version of Campusano didn’t make it past August, when he recorded a 112 wRC+. In September and October 2026, he hit .215/.292/.369, with an 88 wRC+ in 72 plate appearances. Although he improved his OBP to .357 over his 14 postseason plate appearances, his contact rate against pitches in the zone fell considerably, from 83.9% to 70.6%. That regression mattered, since Campusano had runners on base in five of his 10 at-bats against the Brewers in the NLDS. His big at-bat will be remembered: in the second inning of Game 1, he hit a single against a cutter from Jacob Misiorowski that came right down the middle of the zone, putting the Padres ahead 1-0. However, he didn’t drive in another run in his remaining nine plate appearances. In each of them, he had the chance to change the score, since he always came to the plate with the game tied or with a one-run difference, whether the Padres were ahead or behind. Samad Taylor Contact ability, one of the elements that drove Taylor’s at-bats for much of the year, suffered its biggest regression in the postseason: his out-of-zone swing rate increased from 30.6% to 46.7%. He didn’t draw any walks, and his strikeout rate jumped from 21.1% to 40%. Yes, I haven’t forgotten his reaction when he struck out looking at Ashby’s curveball for the third out of the seventh inning in Game 4. Ty France All of his months were solid, featuring at least a 123 wRC+, and he finished September with an impressive 140 mark. His bat made a difference for the Padres, and it’s very likely that he will receive a contract offer, since he will be a free agent in a matter of weeks. In any case, people will talk for a long time about the fly ball he hit off the roof of American Family Field in Game 1. Statcast projected it as a potential home run in one of the 30 ballparks, with a chance to become a home run only at Daikin Park. From Game 2 onward, France finished 2-for-10 and drove in just one run. Xander Bogaerts You may find it surprising, but Bogaerts hit only two balls that clearly got past the infield against the Brewers. Both were line drives: a single against Antonio Senzatela, with the bases empty and two outs in the sixth inning of Game 3, and a line-drive out to right field against Robert Gasser. Bogaerts had finished the Wild Card Series against the Chicago Cubs 4-for-8, with a double, a home run and two RBIs, but the Brewers limited him to a puzzling .154/.267/.154 slash line, with just a 32 wRC+ in 15 plate appearances.
 -
The problem was in front of our eyes the entire time, and time keeps proving that we were not wrong. There has not been a more difficult left-handed-hitting offense to beat in these playoffs than the Milwaukee Brewers. With a sweep of the Los Angeles Dodgers in the NLCS now behind them, it's clear how good their lineup really is. Prior to heading to L.A. for those final two games of the championship series, Milwaukee’s left-handed hitters lead the postseason with a 115 wRC+, .270 batting average, .398 on-base percentage, and the pure identity of their “small-ball” game, a .371 BABIP and 2.25 GB/FB. So, when the San Diego Padres finished quickly annihilating the Chicago Cubs in the Wild Card Series, it was inevitable to start exploring what the matchups and the keys might be for them to stop the Brewers. Obviously, we know that it was not about some command mistakes that could be destroyed by big swings. That is not what the Brewers usually do. The Padres had overcome the Cubs’ left-handed hitters by limiting them to an 0-for-14 line with a 41.2 K% in 17 plate appearances. Perhaps Chicago could have recovered somewhat if the series had been best-of-five or best-of-seven, but they never managed to make the adjustments. Instead, the pitching could not stop Milwaukee’s left-handed hitters. Robbie Ray was never able to meet the level the Padres needed from him after acquiring him at the trade deadline, and along with Walker Buehler, Jason Adam, and Adrian Morejon, they could not record a single strikeout against the 26 batters they faced combined. Although the samples were small, with the exception of Joe Musgrove, Michael King, and Nick Pivetta, the rest of the pitchers struggled to prevent left-handed hitters from reaching base. How did the Brewers manage to be so consistent? Let’s explore some interesting details in this pair of charts. On the left is the expected batting averages of the Brewers’ left-handed hitters against San Diego’s pitchers in the past postseason, and on the right, the summary of all hitters. It is easy to notice one particular detail: the ability to get good results against pitches on the edges of the strike zone, right where they should be more difficult to reach. This result reveals how difficult it was to avoid contact and strike out most of these hitters, who tend to be aggressive throughout the zone. The best averages are precisely against low pitches over the plate, and in the high-and-outside zone for left-handed hitters, locations where the Padres were more dominant throughout the regular season. As you can see here, San Diego managed to limit left-handed hitters in the high-and-outside zone, and they had no problems when they pitched outside the strike zone. But the plan did not work against Milwaukee and, in the end, it was the left-handed hitters who made the difference with their quality at-bats. Yes, Jackson Chourio (six RBIs) and William Contreras (two RBIs) combined to capitalize on several key at-bats with runners on base that shaped the direction of the series, but when you look at the final results, it was the left-handed hitters who did the most damage; they scored eight of Milwaukee’s 13 runs, with five stolen bases in the same number of attempts. View full article
-
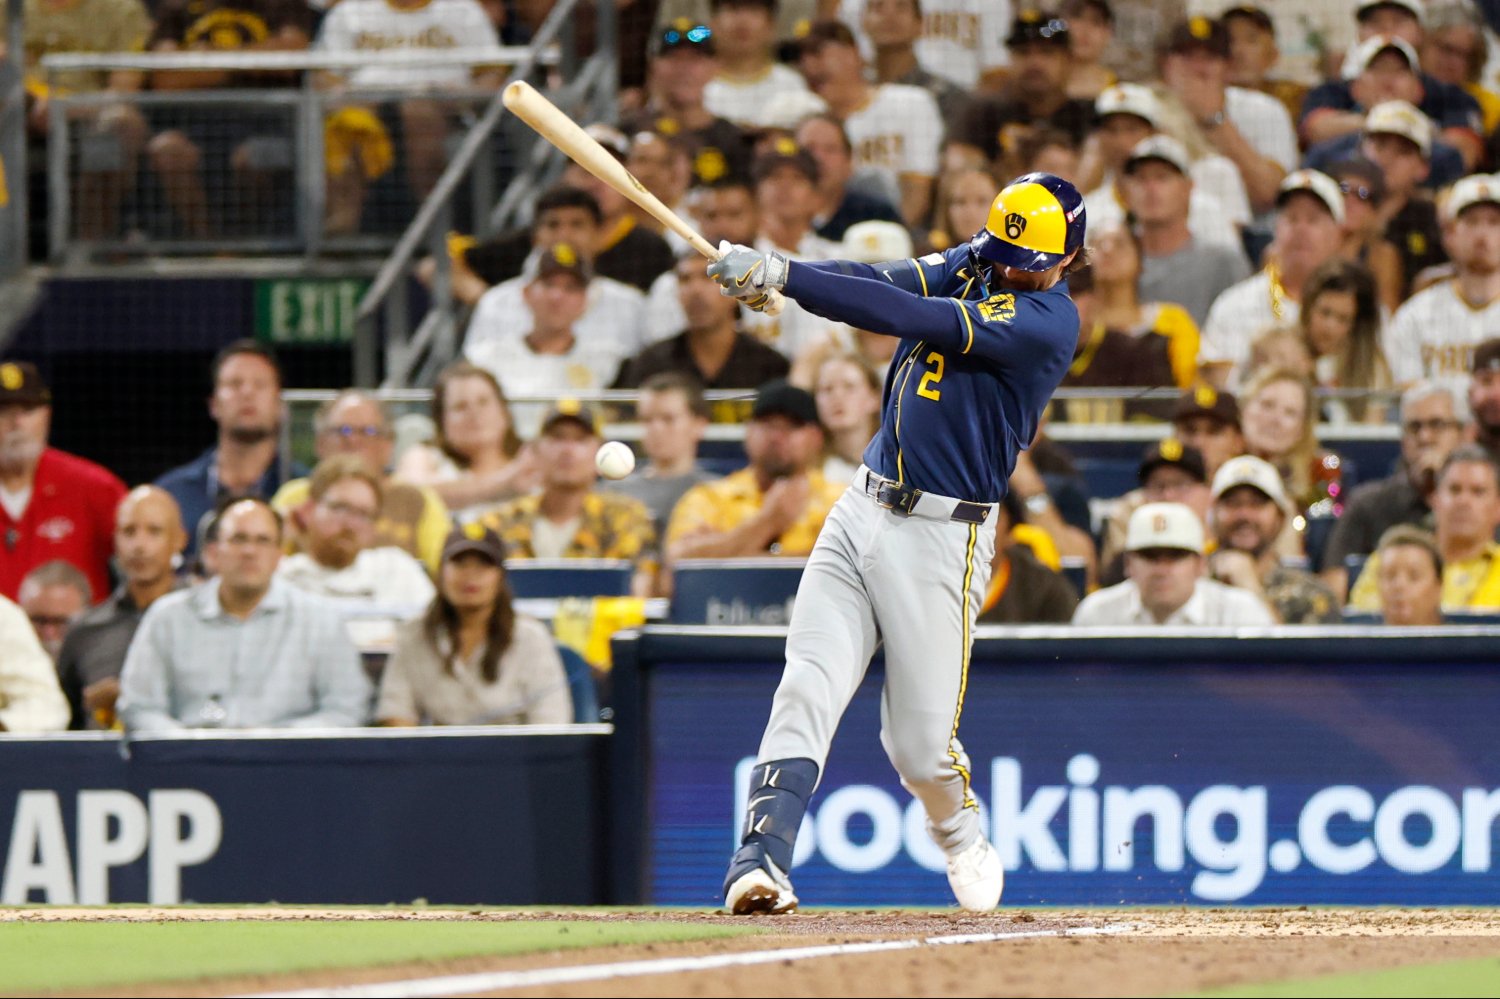 The problem was in front of our eyes the entire time, and time keeps proving that we were not wrong. There has not been a more difficult left-handed-hitting offense to beat in these playoffs than the Milwaukee Brewers. With a sweep of the Los Angeles Dodgers in the NLCS now behind them, it's clear how good their lineup really is. Prior to heading to L.A. for those final two games of the championship series, Milwaukee’s left-handed hitters lead the postseason with a 115 wRC+, .270 batting average, .398 on-base percentage, and the pure identity of their “small-ball” game, a .371 BABIP and 2.25 GB/FB. So, when the San Diego Padres finished quickly annihilating the Chicago Cubs in the Wild Card Series, it was inevitable to start exploring what the matchups and the keys might be for them to stop the Brewers. Obviously, we know that it was not about some command mistakes that could be destroyed by big swings. That is not what the Brewers usually do. The Padres had overcome the Cubs’ left-handed hitters by limiting them to an 0-for-14 line with a 41.2 K% in 17 plate appearances. Perhaps Chicago could have recovered somewhat if the series had been best-of-five or best-of-seven, but they never managed to make the adjustments. Instead, the pitching could not stop Milwaukee’s left-handed hitters. Robbie Ray was never able to meet the level the Padres needed from him after acquiring him at the trade deadline, and along with Walker Buehler, Jason Adam, and Adrian Morejon, they could not record a single strikeout against the 26 batters they faced combined. Although the samples were small, with the exception of Joe Musgrove, Michael King, and Nick Pivetta, the rest of the pitchers struggled to prevent left-handed hitters from reaching base. How did the Brewers manage to be so consistent? Let’s explore some interesting details in this pair of charts. On the left is the expected batting averages of the Brewers’ left-handed hitters against San Diego’s pitchers in the past postseason, and on the right, the summary of all hitters. It is easy to notice one particular detail: the ability to get good results against pitches on the edges of the strike zone, right where they should be more difficult to reach. This result reveals how difficult it was to avoid contact and strike out most of these hitters, who tend to be aggressive throughout the zone. The best averages are precisely against low pitches over the plate, and in the high-and-outside zone for left-handed hitters, locations where the Padres were more dominant throughout the regular season. As you can see here, San Diego managed to limit left-handed hitters in the high-and-outside zone, and they had no problems when they pitched outside the strike zone. But the plan did not work against Milwaukee and, in the end, it was the left-handed hitters who made the difference with their quality at-bats. Yes, Jackson Chourio (six RBIs) and William Contreras (two RBIs) combined to capitalize on several key at-bats with runners on base that shaped the direction of the series, but when you look at the final results, it was the left-handed hitters who did the most damage; they scored eight of Milwaukee’s 13 runs, with five stolen bases in the same number of attempts.
 -
The San Diego Padres are still alive after a dramatic 4-3 victory in Game 3 against the Milwaukee Brewers in the return to Petco Park. There will be a Game 4, and that leaves a lot of hope for the team and the fans, despite the fact that they are facing the most successful team of the regular season. However, San Diego could face an even more complicated challenge in Game 4: trying to find all the sufficient innings from the bullpen if they cannot count on left-hander Adrian Morejon and Mason Miller. Miller was not available in Game 3 after being placed on the paternity list, and Morejon is dealing with shoulder fatigue. It's unclear as of now if either (or both) pitcher will be able to go tonight. After throwing five innings with three hits allowed and one run on 72 pitches last Sunday in Game 2, Michael King handled the Padres’ final two innings with a spectacular finish, inducing Christian Yelich to hit into a double play to close out the game and preserve the one-run lead. King needed to throw 40 pitches, which adds up to a total of 112 over the last two playoff games. It has been a performance worthy of applause, as the ace of the staff has carried a huge part of the pitching load so far. Meanwhile, the other starters, Robbie Ray in Game 1 and Nick Pivetta in Game 2, combined for 114 pitches. Neither of them was dominant enough to control the Brewers’ offense and neither managed to earn the confidence to complete five innings. This is what the starters’ performances looked like: King: 7 IP, 4 H, 1 R, 1 ER, 2 BB, 7 SO, 0 HR, 27 BF, 63 Game Score, SV Ray and Pivetta combined: 7 IP, 9 H, 4 R, 4 ER, 2 BB, 5 SO, 2 HR, 32 BF, 45 Game Score King’s contribution added to the heavy workload the Padres’ bullpen has carried in this NLDS, handling 53.2% of the innings (13 2/3 of 25 2/3), but the plan for Game 4 could become the most complicated game if right-hander Walker Buehler cannot go deep enough. That said, assuming the bullpen will not have the availability of Miller or Morejon, Craig Stammen will need to trust less-heralded arms in high-leverage spots. Historically, Buehler has been a pitcher who tends to rise to the occasion when October arrives and, in fact, the only time he faced the Brewers this season was last August 11, and he had a solid start with six innings of one-run ball, with five strikeouts, two walks and only three hits allowed in the Padres’ 11-2 victory at Petco Park. However, he has struggled in his career against most of the Brewers’ left-handed hitters. Although the samples are small, it is clear how much of a difference some good at-bats from Milwaukee’s left-handed hitters throughout the lineup could make. Sal Frelick, David Hamilton, Christian Yelich and Garrett Mitchell have combined to go 5-for-13, with only three strikeouts—two by Yelich and one by Mitchell—in 15 plate appearances, while Brice Turang and Jake Bauers have the only extra-base hits, a triple and a home run, respectively. The other key hitter has been Jackson Chourio (1-for-3), who has reached base in two of his four at-bats against Buehler with a pair of RBIs. Therefore, it is clear that left-handed pitchers could play a fundamental role in the bullpen. Left-hander Wandy Peralta was added to the roster for this NLDS in place of Miller and could help alongside Yuki Matsui to face important situations against left-handed hitters. Peralta has an interesting history against the Brewers, as left-handed hitters have hit .276 (8-for-29) against him, with no extra-base hits, only three RBIs, six strikeouts and a pair of walks in 31 matchups. But that offensive line changes considerably when we take Yelich out of the equation, as he has carried a good part of that production with a 5-for-13 line, two RBIs, one walk and a .813 OPS in 14 plate appearances against Peralta. The rest of the hitters combine to go 3-for-16 (.188) with one RBI, four strikeouts and one walk. Matsui has relieved in every game so far, and has allowed only one unearned run and one hit against the 15 batters he has faced in 3 1/3 innings. His biggest complications have come with the two walks he has issued and one batter hit, but in his last two outings none of the four runners he has inherited were able to score. Matsui’s relief appearance in Game 3, when he came in to rescue Jason Adam, marked one of the turning points that kept the Padres alive. He came in and got Turang out with a ground ball to short to end the fifth inning. On the first pitch of the bottom of the fifth, Jake Cronenworth hit a solo home run to break the tie—his first postseason home run since the 2022 NLDS—and the Brewers could not come back on the scoreboard again. Between the fifth and ninth, the bullpen left nine of the 11 runners left on base in the game, including the bases loaded in the fifth inning, and two other scoreless innings with a pair of runners on base against Bradgley Rodriguez—who pitched in his third consecutive game in this NLDS—in the sixth and seventh, respectively. Besides Peralta and Matsui, Ray was warming up in the bullpen to be ready if needed in Game 3, so he could well be another left-handed arm to keep in mind for Game 4. So, if Morejon and Miller are not available this Wednesday for Game 4, it will simply be an all-hands-on-deck type of game for the bullpen. It will be another battle of life or death, so the Padres have to do everything they can to survive. View full article
-
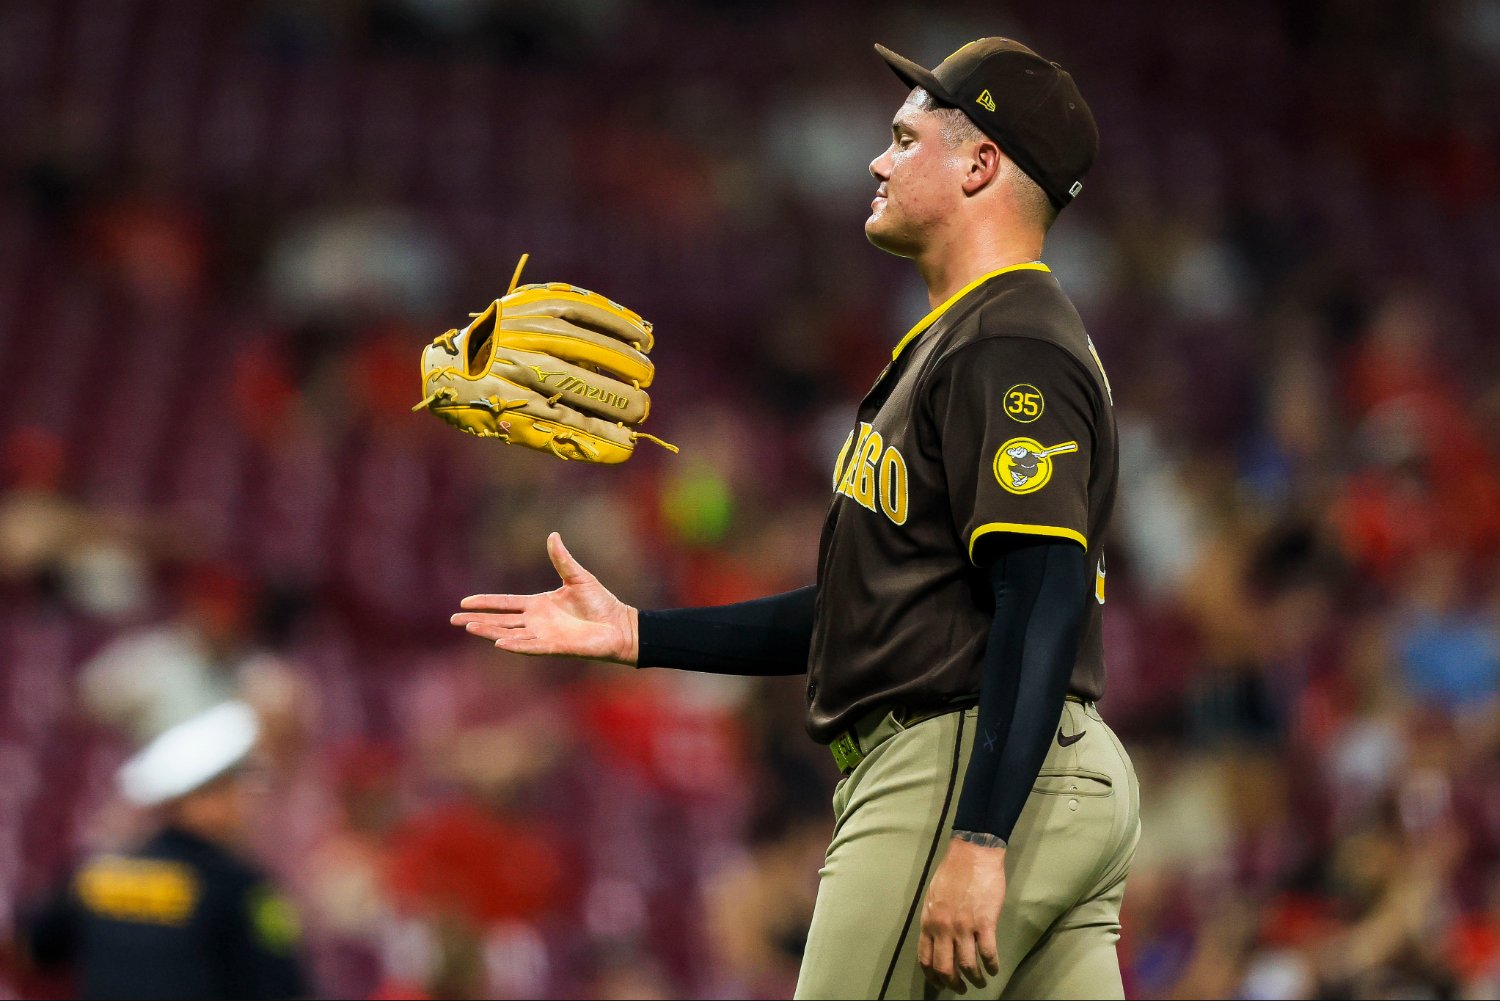 The San Diego Padres are still alive after a dramatic 4-3 victory in Game 3 against the Milwaukee Brewers in the return to Petco Park. There will be a Game 4, and that leaves a lot of hope for the team and the fans, despite the fact that they are facing the most successful team of the regular season. However, San Diego could face an even more complicated challenge in Game 4: trying to find all the sufficient innings from the bullpen if they cannot count on left-hander Adrian Morejon and Mason Miller. Miller was not available in Game 3 after being placed on the paternity list, and Morejon is dealing with shoulder fatigue. It's unclear as of now if either (or both) pitcher will be able to go tonight. After throwing five innings with three hits allowed and one run on 72 pitches last Sunday in Game 2, Michael King handled the Padres’ final two innings with a spectacular finish, inducing Christian Yelich to hit into a double play to close out the game and preserve the one-run lead. King needed to throw 40 pitches, which adds up to a total of 112 over the last two playoff games. It has been a performance worthy of applause, as the ace of the staff has carried a huge part of the pitching load so far. Meanwhile, the other starters, Robbie Ray in Game 1 and Nick Pivetta in Game 2, combined for 114 pitches. Neither of them was dominant enough to control the Brewers’ offense and neither managed to earn the confidence to complete five innings. This is what the starters’ performances looked like: King: 7 IP, 4 H, 1 R, 1 ER, 2 BB, 7 SO, 0 HR, 27 BF, 63 Game Score, SV Ray and Pivetta combined: 7 IP, 9 H, 4 R, 4 ER, 2 BB, 5 SO, 2 HR, 32 BF, 45 Game Score King’s contribution added to the heavy workload the Padres’ bullpen has carried in this NLDS, handling 53.2% of the innings (13 2/3 of 25 2/3), but the plan for Game 4 could become the most complicated game if right-hander Walker Buehler cannot go deep enough. That said, assuming the bullpen will not have the availability of Miller or Morejon, Craig Stammen will need to trust less-heralded arms in high-leverage spots. Historically, Buehler has been a pitcher who tends to rise to the occasion when October arrives and, in fact, the only time he faced the Brewers this season was last August 11, and he had a solid start with six innings of one-run ball, with five strikeouts, two walks and only three hits allowed in the Padres’ 11-2 victory at Petco Park. However, he has struggled in his career against most of the Brewers’ left-handed hitters. Although the samples are small, it is clear how much of a difference some good at-bats from Milwaukee’s left-handed hitters throughout the lineup could make. Sal Frelick, David Hamilton, Christian Yelich and Garrett Mitchell have combined to go 5-for-13, with only three strikeouts—two by Yelich and one by Mitchell—in 15 plate appearances, while Brice Turang and Jake Bauers have the only extra-base hits, a triple and a home run, respectively. The other key hitter has been Jackson Chourio (1-for-3), who has reached base in two of his four at-bats against Buehler with a pair of RBIs. Therefore, it is clear that left-handed pitchers could play a fundamental role in the bullpen. Left-hander Wandy Peralta was added to the roster for this NLDS in place of Miller and could help alongside Yuki Matsui to face important situations against left-handed hitters. Peralta has an interesting history against the Brewers, as left-handed hitters have hit .276 (8-for-29) against him, with no extra-base hits, only three RBIs, six strikeouts and a pair of walks in 31 matchups. But that offensive line changes considerably when we take Yelich out of the equation, as he has carried a good part of that production with a 5-for-13 line, two RBIs, one walk and a .813 OPS in 14 plate appearances against Peralta. The rest of the hitters combine to go 3-for-16 (.188) with one RBI, four strikeouts and one walk. Matsui has relieved in every game so far, and has allowed only one unearned run and one hit against the 15 batters he has faced in 3 1/3 innings. His biggest complications have come with the two walks he has issued and one batter hit, but in his last two outings none of the four runners he has inherited were able to score. Matsui’s relief appearance in Game 3, when he came in to rescue Jason Adam, marked one of the turning points that kept the Padres alive. He came in and got Turang out with a ground ball to short to end the fifth inning. On the first pitch of the bottom of the fifth, Jake Cronenworth hit a solo home run to break the tie—his first postseason home run since the 2022 NLDS—and the Brewers could not come back on the scoreboard again. Between the fifth and ninth, the bullpen left nine of the 11 runners left on base in the game, including the bases loaded in the fifth inning, and two other scoreless innings with a pair of runners on base against Bradgley Rodriguez—who pitched in his third consecutive game in this NLDS—in the sixth and seventh, respectively. Besides Peralta and Matsui, Ray was warming up in the bullpen to be ready if needed in Game 3, so he could well be another left-handed arm to keep in mind for Game 4. So, if Morejon and Miller are not available this Wednesday for Game 4, it will simply be an all-hands-on-deck type of game for the bullpen. It will be another battle of life or death, so the Padres have to do everything they can to survive.
 -
The San Diego Padres are on the brink of elimination with a 0-2 deficit in the NLDS against a Milwaukee Brewers team that grew stronger with two exciting comebacks at home. But that is not the only worrying news, as Nick Pivetta was announced to take the mound as the starter for the do-or-die contest. Why is that worrying? Well, his terrible past against the Brewers puts him at the center of attention. In five starts, he has a 1-3 record and 8.76 ERA with 24 strikeouts and, worst of all, 14 walks in just 24 2/3 innings. Pivetta was on the injured list from mid-April and returned in September to the rotation. In five outings, he finished with a 2-0 record and 1.64 ERA and allowed only two home runs. His arsenal looked good and he averaged 94 mph after throwing 302 four-seam fastballs, his best peak since he recorded 94.6 mph in 2023. Although he has thrown only 34 2/3 frames this season, Pivetta has been dominant, especially when he mixes the cutter, the sweeper and his curveball. All are pitches that have improved in terms of their perfect contact allowed rates compared to their samples from last year, and they have helped him be more efficient against left-handed hitters. Another key aspect of Pivetta is how consistent he has been when he faces the batting order for the first and second time, limiting his opponents to a .284 and .298 slugging percentage, respectively. His command of the strike zone in that aspect will be vital, since his opponents’ on-base percentage improves when he faces the order for the second time. Pivetta has not allowed home runs this year in that situation, but hitters have improved their contact rate by 5.0%. The Brewers are characterized by having a lineup that adapts to any situation, and it is clear that they need to take advantage of every slip from Pivetta before he can advance and the relievers take over the game. Unfortunately for the Padres, Brewers hitters Pivetta could face in Game 3 have combined for a .302/.370/.508 offensive line, with seven extra-base hits, three of them home runs, and an .878 OPS. Christian Yelich is an old acquaintance of Pivetta. He hit two home runs against him punishing his fastball when he played with the Marlins in the past, but since he has been in Milwaukee he has gone 3-for-7 against him with a double and three RBIs. In most of those counts there was a common denominator, Yelich’s patience, without chasing pitches on the edges of the corners and the high zone. Despite a down season, he could be the biggest threat in the lineup tonight. Let’s take a look at the rest of the hitters, since there are some additional interesting points here: The production from Gary Sanchez and Sal Frelick has mainly come against Pivetta’s fastball, and there have been quality at-bats from Joey Ortiz and Jake Bauers. But in what will be several of the matchups under the greatest pressure, Pivetta has shown dominance against Brice Turang, William Contreras and Jackson Chourio in the past, who combine for a .182/.280/.227 line against the right-hander. However, behind those slash lines, Chourio’s raw talent did not completely disappear, as he averaged a 67% hard-hit rate in the three at-bats in which he put the ball in play. Turang, who in general is 1-for-6 with three strikeouts, also hit the curveball better, leaving Contreras’ case as the most critical, with a 33.3% whiff rate. Pivetta located most of those pitches outside the zone against Contreras, and his only big mistakes came when he left pitches right down the middle. Turang and Bauers went 0-for-8 in Game 2, so it is possible that manager Pat Murphy experiments with some change in the lineup. In any case, Pivetta’s matchups against Contreras and Yelich could be key for both sides. View full article
-
Padres’ Nick Pivetta Faces His Biggest Test Yet Against the Brewers
Yirsandy Rodríguez posted an article in Padres
 The San Diego Padres are on the brink of elimination with a 0-2 deficit in the NLDS against a Milwaukee Brewers team that grew stronger with two exciting comebacks at home. But that is not the only worrying news, as Nick Pivetta was announced to take the mound as the starter for the do-or-die contest. Why is that worrying? Well, his terrible past against the Brewers puts him at the center of attention. In five starts, he has a 1-3 record and 8.76 ERA with 24 strikeouts and, worst of all, 14 walks in just 24 2/3 innings. Pivetta was on the injured list from mid-April and returned in September to the rotation. In five outings, he finished with a 2-0 record and 1.64 ERA and allowed only two home runs. His arsenal looked good and he averaged 94 mph after throwing 302 four-seam fastballs, his best peak since he recorded 94.6 mph in 2023. Although he has thrown only 34 2/3 frames this season, Pivetta has been dominant, especially when he mixes the cutter, the sweeper and his curveball. All are pitches that have improved in terms of their perfect contact allowed rates compared to their samples from last year, and they have helped him be more efficient against left-handed hitters. Another key aspect of Pivetta is how consistent he has been when he faces the batting order for the first and second time, limiting his opponents to a .284 and .298 slugging percentage, respectively. His command of the strike zone in that aspect will be vital, since his opponents’ on-base percentage improves when he faces the order for the second time. Pivetta has not allowed home runs this year in that situation, but hitters have improved their contact rate by 5.0%. The Brewers are characterized by having a lineup that adapts to any situation, and it is clear that they need to take advantage of every slip from Pivetta before he can advance and the relievers take over the game. Unfortunately for the Padres, Brewers hitters Pivetta could face in Game 3 have combined for a .302/.370/.508 offensive line, with seven extra-base hits, three of them home runs, and an .878 OPS. Christian Yelich is an old acquaintance of Pivetta. He hit two home runs against him punishing his fastball when he played with the Marlins in the past, but since he has been in Milwaukee he has gone 3-for-7 against him with a double and three RBIs. In most of those counts there was a common denominator, Yelich’s patience, without chasing pitches on the edges of the corners and the high zone. Despite a down season, he could be the biggest threat in the lineup tonight. Let’s take a look at the rest of the hitters, since there are some additional interesting points here: The production from Gary Sanchez and Sal Frelick has mainly come against Pivetta’s fastball, and there have been quality at-bats from Joey Ortiz and Jake Bauers. But in what will be several of the matchups under the greatest pressure, Pivetta has shown dominance against Brice Turang, William Contreras and Jackson Chourio in the past, who combine for a .182/.280/.227 line against the right-hander. However, behind those slash lines, Chourio’s raw talent did not completely disappear, as he averaged a 67% hard-hit rate in the three at-bats in which he put the ball in play. Turang, who in general is 1-for-6 with three strikeouts, also hit the curveball better, leaving Contreras’ case as the most critical, with a 33.3% whiff rate. Pivetta located most of those pitches outside the zone against Contreras, and his only big mistakes came when he left pitches right down the middle. Turang and Bauers went 0-for-8 in Game 2, so it is possible that manager Pat Murphy experiments with some change in the lineup. In any case, Pivetta’s matchups against Contreras and Yelich could be key for both sides.
 -
Padres' Offense Has No Room to Continue Wasting Opportunities
Yirsandy Rodríguez posted an article in Padres
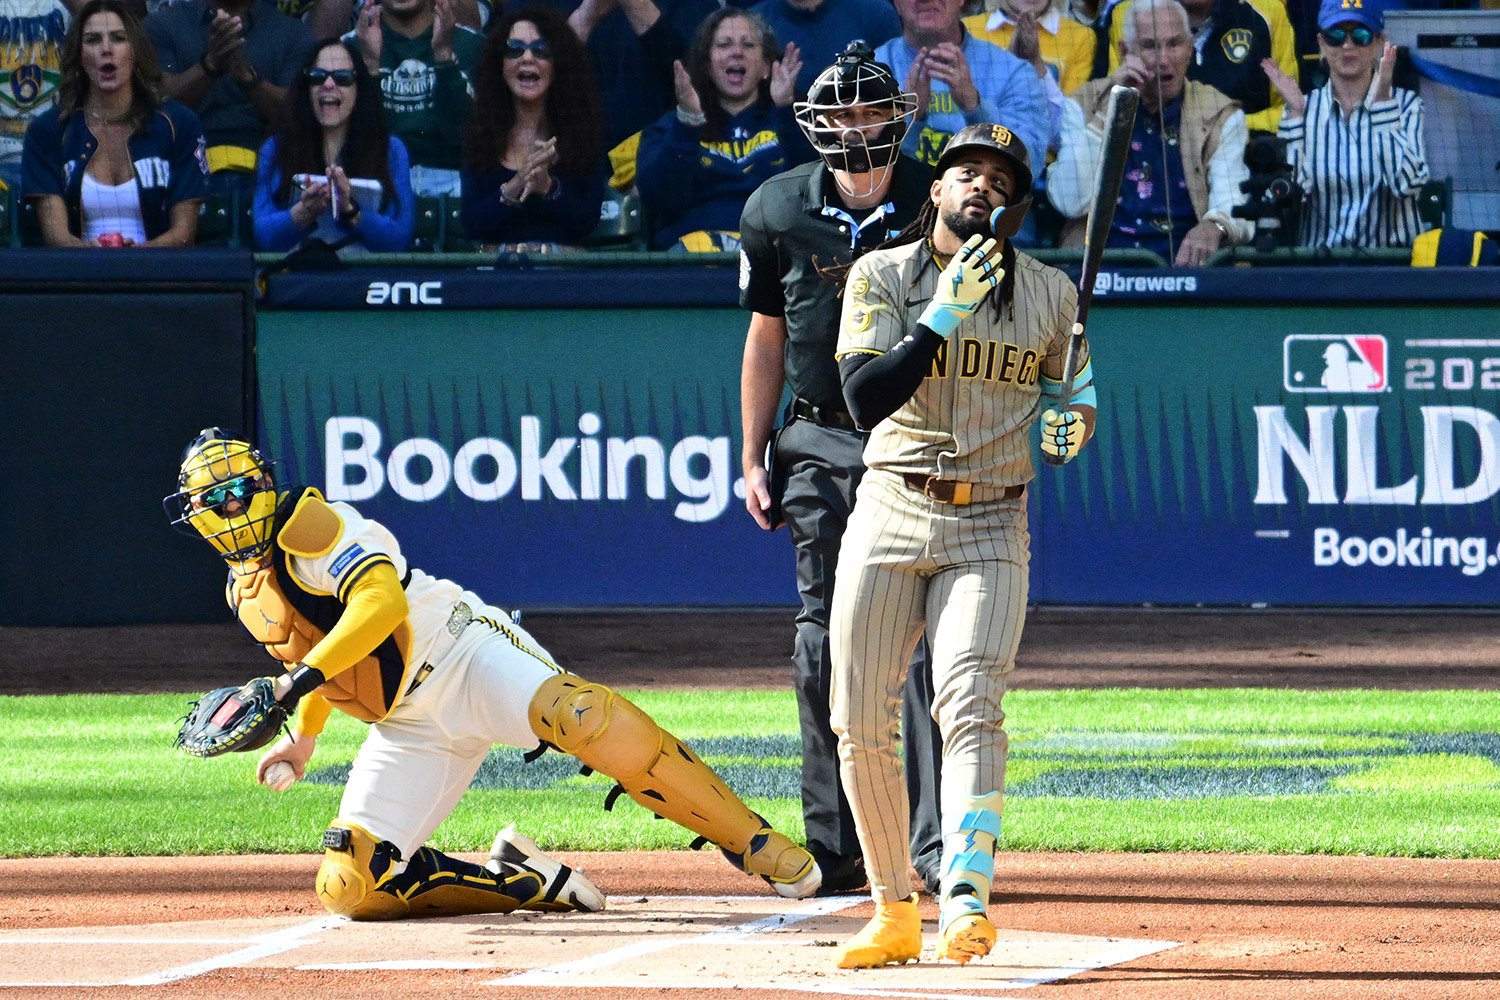 It has not been for a lack of opportunities. The San Diego Padres have lost two games by one run, despite leading on the scoreboard in 10 of their 18 innings. Okay, I admit that even with that poor production, neither of their two main relievers, Adrian Morejon in Game 1 and Mason Miller in Game 2, was able to dominate to hold the tie and the lead. But even before getting there, the Padres had enough opportunities to change the scoreboard and allow the bullpen to work much more comfortably against a lineup as productive as the Brewers’. In the two games, San Diego has let 13 opportunities to score runs with runners in scoring position slip away after taking the lead. All you want in October is for most of the important at-bats that could give the game a definitive turn to come when your best hitters step to the plate. The Padres have not lacked them, although ten of them came in Game 2. Fernando Tatis Jr. has had the opportunity in three of them, including the only at-bat in an RISP situation when the Padres had a 2-0 lead against Jacob Misiorowski. Tatis Jr. hit a ground ball to Miz himself, advancing the runners to second and third. Then Dustin Harris walked after a great seven-pitch at-bat to load the bases, but Manny Machado was dominated on the first pitch with a ground ball to the shortstop. Series Gm# Batter Pitcher Score Event Inn RoB Out Pit(cnt) WPA NLDS 1 Dustin Harris Jacob Misiorowski ahead 0-2 BB t2 -23 2 7 (3-2) 0.01 NLDS 1 Fernando Tatis Jr. Jacob Misiorowski ahead 0-2 Out t2 12- 1 4 (1-2) -0.02 NLDS 1 Manny Machado Jacob Misiorowski ahead 0-2 Out t2 123 2 1 (0-0) -0.1 The Padres could not take enough advantage of Misiorowski's slightly-off day, and then the bullpen prevented them from having more real opportunities to increase their win probability for the rest of the game. That was the prelude to Game 2, where the Brewers no longer had Miz, and had to face the bullpen for the second time. Series Gm# Batter Pitcher Score Event Inn RoB Out Pit(cnt) WPA NLDS 2 Fernando Tatis Jr. Logan Henderson ahead 0-1 Out t2 12- 2 1 (0-0) -0.04 NLDS 2 Jake Cronenworth Logan Henderson ahead 0-1 Out t2 12- 1 1 (0-0) -0.04 NLDS 2 Luis Campusano Logan Henderson ahead 0-1 BB t2 1-- 1 4 (3-0) 0.03 NLDS 2 Fernando Tatis Jr. Logan Henderson ahead 0-1 FC t5 1-- 1 2 (0-1) 0.07 NLDS 2 Manny Machado Logan Henderson ahead 0-2 Out t5 -2- 2 4 (1-2) -0.03 NLDS 2 Austin Hays JoJo Romero ahead 1-2 SO t6 1-- 1 5 (2-2) -0.03 NLDS 2 Luis Campusano Abner Uribe ahead 1-2 Out t6 12- 2 5 (2-2) -0.05 NLDS 2 Dustin Harris Abner Uribe ahead 1-2 Out t7 1-- 1 5 (2-2) -0.03 NLDS 2 Freddy Fermin Aaron Ashby ahead 2-3 Out t8 12- 1 3 (0-2) -0.09 NLDS 2 Xander Bogaerts Aaron Ashby ahead 2-3 SO t8 12- 0 7 (3-2) -0.05 However, the biggest loss of opportunities came in Game 2, when the Padres let five opportunities that could have become glorious postseason at-bats slip away against Logan Henderson, three of them in the second inning and two in the fifth. Tatis Jr. and Machado failed again, and in the eighth, Freddy Fermin and Xander Bogaerts left runners on first and second with fewer than two outs. Beyond the clutch situations, credit has to be given to the Brewers’ pitching, as San Diego’s power has completely disappeared, and they had the bad luck that Ty France’s fly ball that could have changed the series hit the roof cables at American Family Field. The Padres are slashing .206/.316/.221, with no home runs, and have struck out 16 times in 79 plate appearances. With runners in scoring position, they have been worse, falling to .167/.250/.167, but with one important sign, which is that they have struck out only three times in 20 at-bats. The Brewers will send right-hander Dustin May to the mound as their starter in Game 3, and he will face San Diego for the fourth time this season. Two came with the St. Louis Cardinals and one after arriving in Milwaukee at the trade deadline, to post a 1-1 record, a 1.23 ERA and 22 strikeouts in 22 innings. All three were quality starts, and on June 15 he threw a shutout with nine strikeouts and only one hit allowed, a single by Manny Machado that broke up his no-hitter with one out in the top of the seventh. Rk Player B PA AB H 2B 3B HR RBI BB SO BA OBP SLG OPS SH SF IBB HBP GIDP 1 Manny Machado R 42 40 10 2 0 2 5 2 8 .250 .286 .450 .736 0 0 0 0 4 2 Fernando Tatis Jr. R 31 28 7 1 0 1 4 3 6 .250 .323 .393 .715 0 0 0 0 0 3 Jake Cronenworth L 25 21 5 0 0 1 1 3 4 .238 .360 .381 .741 0 0 0 1 1 4 Xander Bogaerts R 17 16 3 1 0 1 1 1 3 .188 .235 .438 .673 0 0 0 0 0 5 Ty France R 13 12 4 0 0 1 1 0 3 .333 .385 .583 .968 0 0 0 1 1 6 Jackson Merrill L 12 10 0 0 0 0 1 1 4 .000 .083 .000 .083 0 1 0 0 1 7 Gavin Sheets L 12 11 1 0 0 0 0 1 1 .091 .167 .091 .258 0 0 0 0 1 8 Freddy Fermin R 6 6 2 0 0 0 0 0 2 .333 .333 .333 .667 0 0 0 0 0 9 Sung-Mun Song L 5 4 0 0 0 0 0 1 1 .000 .200 .000 .200 0 0 0 0 0 10 Austin Hays R 4 4 1 1 0 0 0 0 1 .250 .250 .500 .750 0 0 0 0 1 As you can see here, there are five hitters who have combined to hit six home runs against May, with Machado accounting for two, despite the offensive line being low at .217/.281/.368, and they have not been able to take enough advantage of the impact of the power. There is also a group of four hitters who have not been easy outs for May, Xander Bogaerts, Gavin Sheets, Jackson Merrill and Sung-Mun Song, who combine for 4-for-41 with a .098/.174/.195 line. But there is a key point that San Diego’s hitters have to exploit to attack May, and that is that his fastball did not finish well in September. Hitters destroyed the three pitches he throws the most, averaging above .500 xSLG against the sinker (.716), cutter (.504), and four-seam fastball (.514). In that group, Manny Machado and Ty France stand out among those who have connected best against his sinker and four-seam fastball. May tends to be a pretty uncomfortable pitcher because he has a tendency to pitch inside and then combine his curveball, sweeper, and changeup to generate swings and misses and make hitters chase pitches on the corners and outside the strike zone. He improved by incorporating a high-impact curveball with 55.3 inches of total drop, combined with the vertical profile of his sweeper at -3.9 inches, so we will see if he can repeat his dominance or if the Padres can wake up and get better at-bats to stay alive in these playoffs.
 -
It has not been for a lack of opportunities. The San Diego Padres have lost two games by one run, despite leading on the scoreboard in 10 of their 18 innings. Okay, I admit that even with that poor production, neither of their two main relievers, Adrian Morejon in Game 1 and Mason Miller in Game 2, was able to dominate to hold the tie and the lead. But even before getting there, the Padres had enough opportunities to change the scoreboard and allow the bullpen to work much more comfortably against a lineup as productive as the Brewers’. In the two games, San Diego has let 13 opportunities to score runs with runners in scoring position slip away after taking the lead. All you want in October is for most of the important at-bats that could give the game a definitive turn to come when your best hitters step to the plate. The Padres have not lacked them, although ten of them came in Game 2. Fernando Tatis Jr. has had the opportunity in three of them, including the only at-bat in an RISP situation when the Padres had a 2-0 lead against Jacob Misiorowski. Tatis Jr. hit a ground ball to Miz himself, advancing the runners to second and third. Then Dustin Harris walked after a great seven-pitch at-bat to load the bases, but Manny Machado was dominated on the first pitch with a ground ball to the shortstop. Series Gm# Batter Pitcher Score Event Inn RoB Out Pit(cnt) WPA NLDS 1 Dustin Harris Jacob Misiorowski ahead 0-2 BB t2 -23 2 7 (3-2) 0.01 NLDS 1 Fernando Tatis Jr. Jacob Misiorowski ahead 0-2 Out t2 12- 1 4 (1-2) -0.02 NLDS 1 Manny Machado Jacob Misiorowski ahead 0-2 Out t2 123 2 1 (0-0) -0.1 The Padres could not take enough advantage of Misiorowski's slightly-off day, and then the bullpen prevented them from having more real opportunities to increase their win probability for the rest of the game. That was the prelude to Game 2, where the Brewers no longer had Miz, and had to face the bullpen for the second time. Series Gm# Batter Pitcher Score Event Inn RoB Out Pit(cnt) WPA NLDS 2 Fernando Tatis Jr. Logan Henderson ahead 0-1 Out t2 12- 2 1 (0-0) -0.04 NLDS 2 Jake Cronenworth Logan Henderson ahead 0-1 Out t2 12- 1 1 (0-0) -0.04 NLDS 2 Luis Campusano Logan Henderson ahead 0-1 BB t2 1-- 1 4 (3-0) 0.03 NLDS 2 Fernando Tatis Jr. Logan Henderson ahead 0-1 FC t5 1-- 1 2 (0-1) 0.07 NLDS 2 Manny Machado Logan Henderson ahead 0-2 Out t5 -2- 2 4 (1-2) -0.03 NLDS 2 Austin Hays JoJo Romero ahead 1-2 SO t6 1-- 1 5 (2-2) -0.03 NLDS 2 Luis Campusano Abner Uribe ahead 1-2 Out t6 12- 2 5 (2-2) -0.05 NLDS 2 Dustin Harris Abner Uribe ahead 1-2 Out t7 1-- 1 5 (2-2) -0.03 NLDS 2 Freddy Fermin Aaron Ashby ahead 2-3 Out t8 12- 1 3 (0-2) -0.09 NLDS 2 Xander Bogaerts Aaron Ashby ahead 2-3 SO t8 12- 0 7 (3-2) -0.05 However, the biggest loss of opportunities came in Game 2, when the Padres let five opportunities that could have become glorious postseason at-bats slip away against Logan Henderson, three of them in the second inning and two in the fifth. Tatis Jr. and Machado failed again, and in the eighth, Freddy Fermin and Xander Bogaerts left runners on first and second with fewer than two outs. Beyond the clutch situations, credit has to be given to the Brewers’ pitching, as San Diego’s power has completely disappeared, and they had the bad luck that Ty France’s fly ball that could have changed the series hit the roof cables at American Family Field. The Padres are slashing .206/.316/.221, with no home runs, and have struck out 16 times in 79 plate appearances. With runners in scoring position, they have been worse, falling to .167/.250/.167, but with one important sign, which is that they have struck out only three times in 20 at-bats. The Brewers will send right-hander Dustin May to the mound as their starter in Game 3, and he will face San Diego for the fourth time this season. Two came with the St. Louis Cardinals and one after arriving in Milwaukee at the trade deadline, to post a 1-1 record, a 1.23 ERA and 22 strikeouts in 22 innings. All three were quality starts, and on June 15 he threw a shutout with nine strikeouts and only one hit allowed, a single by Manny Machado that broke up his no-hitter with one out in the top of the seventh. Rk Player B PA AB H 2B 3B HR RBI BB SO BA OBP SLG OPS SH SF IBB HBP GIDP 1 Manny Machado R 42 40 10 2 0 2 5 2 8 .250 .286 .450 .736 0 0 0 0 4 2 Fernando Tatis Jr. R 31 28 7 1 0 1 4 3 6 .250 .323 .393 .715 0 0 0 0 0 3 Jake Cronenworth L 25 21 5 0 0 1 1 3 4 .238 .360 .381 .741 0 0 0 1 1 4 Xander Bogaerts R 17 16 3 1 0 1 1 1 3 .188 .235 .438 .673 0 0 0 0 0 5 Ty France R 13 12 4 0 0 1 1 0 3 .333 .385 .583 .968 0 0 0 1 1 6 Jackson Merrill L 12 10 0 0 0 0 1 1 4 .000 .083 .000 .083 0 1 0 0 1 7 Gavin Sheets L 12 11 1 0 0 0 0 1 1 .091 .167 .091 .258 0 0 0 0 1 8 Freddy Fermin R 6 6 2 0 0 0 0 0 2 .333 .333 .333 .667 0 0 0 0 0 9 Sung-Mun Song L 5 4 0 0 0 0 0 1 1 .000 .200 .000 .200 0 0 0 0 0 10 Austin Hays R 4 4 1 1 0 0 0 0 1 .250 .250 .500 .750 0 0 0 0 1 As you can see here, there are five hitters who have combined to hit six home runs against May, with Machado accounting for two, despite the offensive line being low at .217/.281/.368, and they have not been able to take enough advantage of the impact of the power. There is also a group of four hitters who have not been easy outs for May, Xander Bogaerts, Gavin Sheets, Jackson Merrill and Sung-Mun Song, who combine for 4-for-41 with a .098/.174/.195 line. But there is a key point that San Diego’s hitters have to exploit to attack May, and that is that his fastball did not finish well in September. Hitters destroyed the three pitches he throws the most, averaging above .500 xSLG against the sinker (.716), cutter (.504), and four-seam fastball (.514). In that group, Manny Machado and Ty France stand out among those who have connected best against his sinker and four-seam fastball. May tends to be a pretty uncomfortable pitcher because he has a tendency to pitch inside and then combine his curveball, sweeper, and changeup to generate swings and misses and make hitters chase pitches on the corners and outside the strike zone. He improved by incorporating a high-impact curveball with 55.3 inches of total drop, combined with the vertical profile of his sweeper at -3.9 inches, so we will see if he can repeat his dominance or if the Padres can wake up and get better at-bats to stay alive in these playoffs. View full article
-
When the San Diego Padres acquired veteran left-hander Robbie Ray at the trade deadline, they did it thinking about October, so this is the moment when they need his contribution the most: Game 1 of the NLDS against the Milwaukee Brewers, the most consistent team in baseball this season. Ray arrives with a negative experience under the October lights, pitching to a 0-3 record with a 7.43 ERA in six postseason appearances, only two of them as a starter. His 13 innings pitched have come over a span between 2017 and 2022, with the terrible memory of allowing a walk-off home run by Yordan Alvarez in the ninth inning on Oct. 11, 2022, when the Seattle Mariners needed one out to win 7-5. His last outing was also in relief in the 18th inning, three days later in Game 3, when Seattle lost 1-0 and ended up being swept in the ALDS. Now Ray has a new opportunity for redemption after that nightmare in October, but he will have to overcome what could be considered his worst moment of this campaign. His performance in the second half of the season in San Diego fell somewhat short of expectations, although, overall, Ray remained the pitcher who had finished the first half with the San Francisco Giants. His xFIP rose from 4.87 to 4.98 since the All-Star break, and hitters considerably increased their BABIP from .238 to .298. Even so, I would say that Ray’s biggest problem continues to be his inconsistency in preventing runs, as his left-handed profile continues to present control problems and more vulnerable points against right-handed hitters. Season Handedness O-Swing% Z-Swing% Swing% O-Contact% Z-Contact% FastSw% K-BB% Barrel% HR OPS 2026 vs L 27.7% 66.9% 44.7% 53.8% 83.6% 23.3% 11.9% 3.8% 2 .680 2026 vs R 28.5% 71.1% 46.7% 61.5% 88.5% 30.8% 6.5% 9.6% 20 .719 Right-handed hitters have recorded similar swing rates to left-handed hitters, against pitches inside and outside the strike zone, but the impact of the contact is different, producing 20 of the 24 home runs Ray has allowed all year. In a certain way, it seems like a strange combination, since left-handed hitters have a high strikeout-to-walk rate, but improve those dividends with more BABIP (.333 vs. .231 against right-handed hitters). In any case, these trends bring us to two points that could be key in Game 1: how much Ray can dominate the left-handed hitters the Brewers put in the lineup, and whether he can avoid his regular-season collapse when right-handed hitters hit him hard. There is a number in the table that sounds very revealing: the 7.5% difference between the FastSw% of right-handed hitters and left-handed hitters, which clearly reveals the aggressiveness and determination with which they look for his pitches when they choose to swing. So, now an important part of the matchup enters the conversation, and the historical matchup of Ray against the hitters on this Brewers offense. Ray pitched only once in 2026 against Milwaukee; it was this past Aug. 12, and he recorded a short start of 84 pitches in only four innings. He allowed two earned runs and a home run for the third consecutive start against the Brewers, although the previous two were last year, pitching with the Giants. However, the recent numbers from those starts do not tell the whole story of Ray’s success against Milwaukee, although he has allowed seven runs, 13 hits and three home runs over 14 innings in his last three starts. Milwaukee hitters have produced a line of just .194/.306/.323, with two home runs — both by Gary Sanchez — five RBIs, 15 strikeouts and 10 walks in 72 plate appearances. Even allowing a home run in each of his last three starts, the Brewers have combined for less than a .200 BA, a .305 on-base percentage and a slugging percentage below .325. That sounds good, and in 72 plate appearances there are some interesting points there. Player PA Pit/PA HR K% BB% xOBP xSLG xwOBA Whiff% Hard Hit% Ortiz, Joey 3 6.0 0 33.3% 33.3% .362 .044 .260 25.0% 100.0% Bauers, Jake 2 6.0 0 0.0% 50.0% .525 .076 .376 20.0% 0.0% Contreras, William 10 5.3 0 20.0% 40.0% .468 .184 .354 27.3% 25.0% Sánchez, Gary 9 4.6 2 22.2% 11.1% .337 .910 .496 36.4% 50.0% Yelich, Christian 6 4.2 0 0.0% 16.7% .449 .696 .477 33.3% 60.0% Turang, Brice 7 3.9 0 28.6% 0.0% .282 .447 .311 31.3% 60.0% Chourio, Jackson 5 3.8 0 0.0% 0.0% .364 .548 .391 12.5% 60.0% Lockridge, Brandon 6 3.7 0 50.0% 0.0% .119 .231 .147 54.5% 66.7% Frelick, Sal 5 3.4 0 0.0% 20.0% .546 .480 .458 14.3% 0.0% Hamilton, David 2 2.5 0 0.0% 0.0% .232 .313 .233 0.0% 0.0% Ray has been a strikeout pitcher against Brewers hitters, with a swing-and-miss rate above 25% against six of the 10 hitters on the list. But, if you look, at the same time, he allows 50% or more Hard Hit% against six of them. Yelich and Turang appear among the left-handed hitters who have hit him the best, while Sanchez, Chourio and Lockridge lead the impact from the right-handed hitters. The strikeouts have been there once Ray has been able to get ahead in the count, but he has also run the risk of walking hitters or ending up giving up a pitch in a count with an advantage for the hitter. I don’t know what feeling you get when analyzing all these trends, but they describe perfectly to me what Ray has been at least since he arrived in San Diego: at times, some flashes of the intelligent left-hander who could surprise hitters with pitches on the corners and in the upper third of the strike zone, but often, inconsistent in throwing quality strikes, maintaining his command and resolving game situations without wearing himself out so much. Look at one more detail, and it is that half of the hitters have seen him average at least 4.2 pitches per plate appearance, and the lowest average on the entire list is David Hamilton, with 2.5. With the great bullpen San Diego possesses, it's unlikely Ray will be on the mound for very long, especially if he cannot dominate left-handed hitters and gets into trouble early. View full article
-
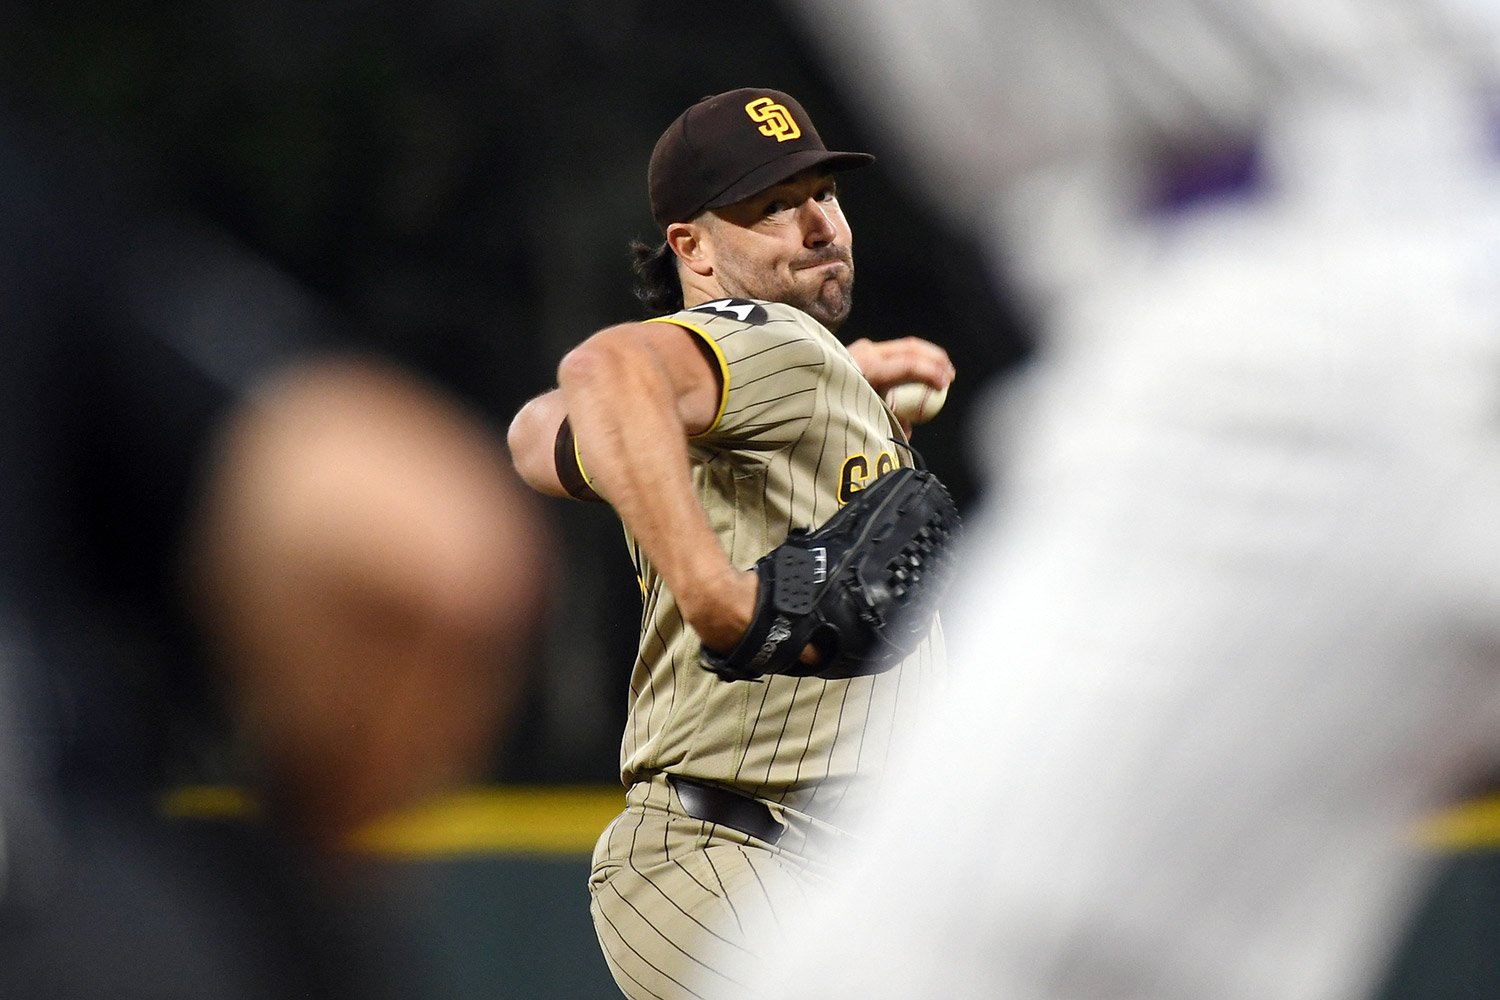 When the San Diego Padres acquired veteran left-hander Robbie Ray at the trade deadline, they did it thinking about October, so this is the moment when they need his contribution the most: Game 1 of the NLDS against the Milwaukee Brewers, the most consistent team in baseball this season. Ray arrives with a negative experience under the October lights, pitching to a 0-3 record with a 7.43 ERA in six postseason appearances, only two of them as a starter. His 13 innings pitched have come over a span between 2017 and 2022, with the terrible memory of allowing a walk-off home run by Yordan Alvarez in the ninth inning on Oct. 11, 2022, when the Seattle Mariners needed one out to win 7-5. His last outing was also in relief in the 18th inning, three days later in Game 3, when Seattle lost 1-0 and ended up being swept in the ALDS. Now Ray has a new opportunity for redemption after that nightmare in October, but he will have to overcome what could be considered his worst moment of this campaign. His performance in the second half of the season in San Diego fell somewhat short of expectations, although, overall, Ray remained the pitcher who had finished the first half with the San Francisco Giants. His xFIP rose from 4.87 to 4.98 since the All-Star break, and hitters considerably increased their BABIP from .238 to .298. Even so, I would say that Ray’s biggest problem continues to be his inconsistency in preventing runs, as his left-handed profile continues to present control problems and more vulnerable points against right-handed hitters. Season Handedness O-Swing% Z-Swing% Swing% O-Contact% Z-Contact% FastSw% K-BB% Barrel% HR OPS 2026 vs L 27.7% 66.9% 44.7% 53.8% 83.6% 23.3% 11.9% 3.8% 2 .680 2026 vs R 28.5% 71.1% 46.7% 61.5% 88.5% 30.8% 6.5% 9.6% 20 .719 Right-handed hitters have recorded similar swing rates to left-handed hitters, against pitches inside and outside the strike zone, but the impact of the contact is different, producing 20 of the 24 home runs Ray has allowed all year. In a certain way, it seems like a strange combination, since left-handed hitters have a high strikeout-to-walk rate, but improve those dividends with more BABIP (.333 vs. .231 against right-handed hitters). In any case, these trends bring us to two points that could be key in Game 1: how much Ray can dominate the left-handed hitters the Brewers put in the lineup, and whether he can avoid his regular-season collapse when right-handed hitters hit him hard. There is a number in the table that sounds very revealing: the 7.5% difference between the FastSw% of right-handed hitters and left-handed hitters, which clearly reveals the aggressiveness and determination with which they look for his pitches when they choose to swing. So, now an important part of the matchup enters the conversation, and the historical matchup of Ray against the hitters on this Brewers offense. Ray pitched only once in 2026 against Milwaukee; it was this past Aug. 12, and he recorded a short start of 84 pitches in only four innings. He allowed two earned runs and a home run for the third consecutive start against the Brewers, although the previous two were last year, pitching with the Giants. However, the recent numbers from those starts do not tell the whole story of Ray’s success against Milwaukee, although he has allowed seven runs, 13 hits and three home runs over 14 innings in his last three starts. Milwaukee hitters have produced a line of just .194/.306/.323, with two home runs — both by Gary Sanchez — five RBIs, 15 strikeouts and 10 walks in 72 plate appearances. Even allowing a home run in each of his last three starts, the Brewers have combined for less than a .200 BA, a .305 on-base percentage and a slugging percentage below .325. That sounds good, and in 72 plate appearances there are some interesting points there. Player PA Pit/PA HR K% BB% xOBP xSLG xwOBA Whiff% Hard Hit% Ortiz, Joey 3 6.0 0 33.3% 33.3% .362 .044 .260 25.0% 100.0% Bauers, Jake 2 6.0 0 0.0% 50.0% .525 .076 .376 20.0% 0.0% Contreras, William 10 5.3 0 20.0% 40.0% .468 .184 .354 27.3% 25.0% Sánchez, Gary 9 4.6 2 22.2% 11.1% .337 .910 .496 36.4% 50.0% Yelich, Christian 6 4.2 0 0.0% 16.7% .449 .696 .477 33.3% 60.0% Turang, Brice 7 3.9 0 28.6% 0.0% .282 .447 .311 31.3% 60.0% Chourio, Jackson 5 3.8 0 0.0% 0.0% .364 .548 .391 12.5% 60.0% Lockridge, Brandon 6 3.7 0 50.0% 0.0% .119 .231 .147 54.5% 66.7% Frelick, Sal 5 3.4 0 0.0% 20.0% .546 .480 .458 14.3% 0.0% Hamilton, David 2 2.5 0 0.0% 0.0% .232 .313 .233 0.0% 0.0% Ray has been a strikeout pitcher against Brewers hitters, with a swing-and-miss rate above 25% against six of the 10 hitters on the list. But, if you look, at the same time, he allows 50% or more Hard Hit% against six of them. Yelich and Turang appear among the left-handed hitters who have hit him the best, while Sanchez, Chourio and Lockridge lead the impact from the right-handed hitters. The strikeouts have been there once Ray has been able to get ahead in the count, but he has also run the risk of walking hitters or ending up giving up a pitch in a count with an advantage for the hitter. I don’t know what feeling you get when analyzing all these trends, but they describe perfectly to me what Ray has been at least since he arrived in San Diego: at times, some flashes of the intelligent left-hander who could surprise hitters with pitches on the corners and in the upper third of the strike zone, but often, inconsistent in throwing quality strikes, maintaining his command and resolving game situations without wearing himself out so much. Look at one more detail, and it is that half of the hitters have seen him average at least 4.2 pitches per plate appearance, and the lowest average on the entire list is David Hamilton, with 2.5. With the great bullpen San Diego possesses, it's unlikely Ray will be on the mound for very long, especially if he cannot dominate left-handed hitters and gets into trouble early.
 -
The San Diego Padres will have to face Jacob Misiorowski and the Milwaukee Brewers in Game 1 of the NLDS, in what will be the second matchup of the year against the fastest and most dominant starter in baseball. Miz received special attention against the Padres on May 13 at home, with 10 strikeouts in seven innings without walking a batter and with only four singles allowed. He threw 93 pitches, and 40 of them were fastballs of at least 100 mph that averaged 101.3. San Diego finished with a swing-and-miss rate of 52.4%, and they put only one ball in play with an exit velocity above 100 mph, a 105.5 mph line-drive single that Gavin Sheets hit in the top of the second inning. Only 12 of those batted balls reached an exit velocity above 85 mph, and the average distance traveled was 155 feet. Something I love about Miz is that, when he starts moving forward, he does not tire easily. He goes through the path being as aggressive as he is devastating, without the slips of the typical strikeout pitcher who sometimes escapes too much from the strike zone, losing command, or needs many pitches to finish off opponents. In 18 of his 30 starts, he threw 90 or more pitches and, even so, in 14 he managed to secure at least six innings, with a minimum of seven strikeouts in 12 of them. Although Misiorowski will probably make some adjustments to offer more room to his curveball against lefties and the slider against righties, especially in two-strike counts, the Padres know that most of the time they will see many fastballs over 100 mph, most of them in the upper third of the strike zone. We do not need to remember how difficult it was for the league to hit Misiorowski’s pitches, but there is an interesting point here that perhaps could make the difference in this second matchup of the year. Let’s analyze for a moment this collection of graphs about Miz’s performance when he threw his fireball fastball against San Diego last May. The highest percentage of pitches was again present in the upper third of the strike zone, looking for that difficult spot where it is much harder for hitters to get to the barrel, although he also located a good portion of his fastball on the outer corner to right-handed hitters. The highest swing-and-miss percentages are also in those areas, as are the higher bat speeds. The results of the three balls put in play that you see were singles, two weak batted balls and Sheets’ line drive. This will be the biggest challenge for the Padres throughout the entire postseason, and there is a possibility that they will have to face Misiorowski twice. But there is a little bit of comfort here, and it is reasonable, since there is no fastball as dominant throughout the league as Miz’s, but there you can see how there are several Padres hitters who have been successful against that type of pitch. There are five hitters with an xSLG above .450, led by Fernando Tatis Jr. and Xander Bogaerts, who were surpassed only by James Wood (.775) of the Nationals. Rk Player B PA AB H 2B 3B HR RBI BB SO BA OBP SLG OPS SH SF IBB HBP GIDP 1 Xander Bogaerts R 3 3 0 0 0 0 0 0 1 .000 .000 .000 .000 0 0 0 0 0 2 Austin Hays R 3 3 2 0 0 0 0 0 0 .667 .667 .667 1.333 0 0 0 0 0 3 Manny Machado R 3 3 0 0 0 0 0 0 0 .000 .000 .000 .000 0 0 0 0 0 4 Jackson Merrill L 3 3 0 0 0 0 0 0 2 .000 .000 .000 .000 0 0 0 0 0 5 Gavin Sheets L 3 3 1 0 0 0 0 0 0 .333 .333 .333 .667 0 0 0 0 0 6 Fernando Tatis Jr. R 3 3 2 0 0 0 0 0 1 .667 .667 .667 1.333 0 0 0 0 0 7 Ty France R 2 2 1 0 0 0 0 0 1 .500 .500 .500 1.000 0 0 0 0 0 As you can see here, there are four hitters with at least one hit among the seven active players on this postseason roster who have faced Misiorowski, including Hays and Tatis Jr. going 2-for-3. Manny Machado is the only one who has struck out a couple of times, and the entire lineup combines for a .300/.300/.300 line, with no extra-base hits, five strikeouts and no walks. The past sample is small, and the challenge in this Game 1 is immense, so we will see if the Padres can have a chance against Misiorowski and change the dominant story from the regular season. View full article
-
How Will Padres Hitters Fare Against Jacob Misiorowski?
Yirsandy Rodríguez posted an article in Padres
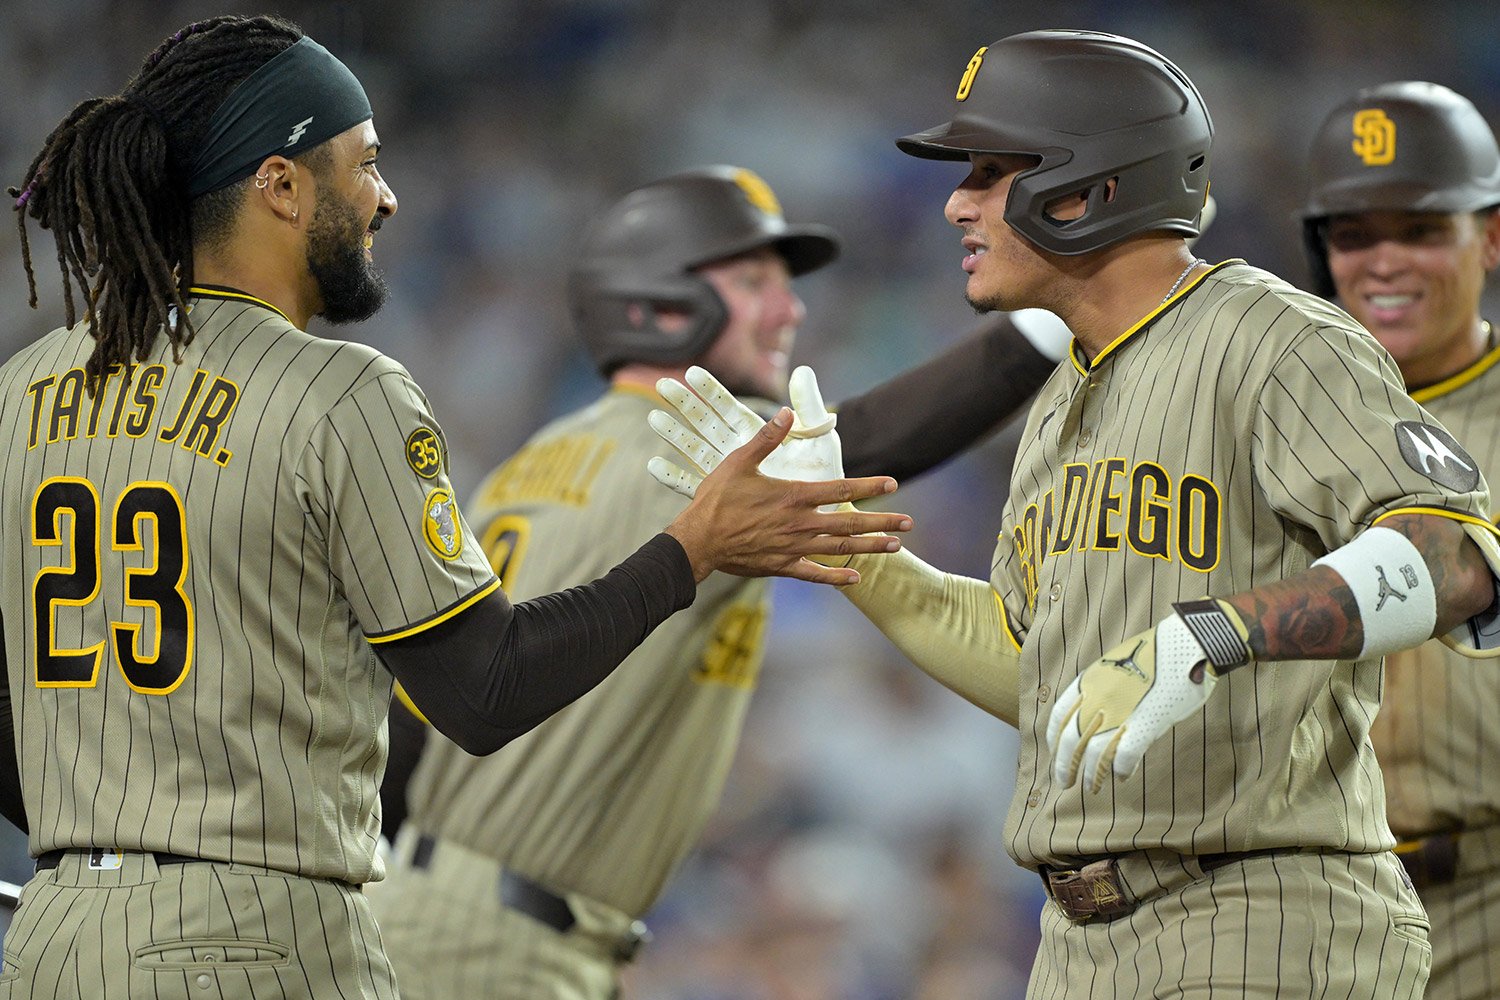 The San Diego Padres will have to face Jacob Misiorowski and the Milwaukee Brewers in Game 1 of the NLDS, in what will be the second matchup of the year against the fastest and most dominant starter in baseball. Miz received special attention against the Padres on May 13 at home, with 10 strikeouts in seven innings without walking a batter and with only four singles allowed. He threw 93 pitches, and 40 of them were fastballs of at least 100 mph that averaged 101.3. San Diego finished with a swing-and-miss rate of 52.4%, and they put only one ball in play with an exit velocity above 100 mph, a 105.5 mph line-drive single that Gavin Sheets hit in the top of the second inning. Only 12 of those batted balls reached an exit velocity above 85 mph, and the average distance traveled was 155 feet. Something I love about Miz is that, when he starts moving forward, he does not tire easily. He goes through the path being as aggressive as he is devastating, without the slips of the typical strikeout pitcher who sometimes escapes too much from the strike zone, losing command, or needs many pitches to finish off opponents. In 18 of his 30 starts, he threw 90 or more pitches and, even so, in 14 he managed to secure at least six innings, with a minimum of seven strikeouts in 12 of them. Although Misiorowski will probably make some adjustments to offer more room to his curveball against lefties and the slider against righties, especially in two-strike counts, the Padres know that most of the time they will see many fastballs over 100 mph, most of them in the upper third of the strike zone. We do not need to remember how difficult it was for the league to hit Misiorowski’s pitches, but there is an interesting point here that perhaps could make the difference in this second matchup of the year. Let’s analyze for a moment this collection of graphs about Miz’s performance when he threw his fireball fastball against San Diego last May. The highest percentage of pitches was again present in the upper third of the strike zone, looking for that difficult spot where it is much harder for hitters to get to the barrel, although he also located a good portion of his fastball on the outer corner to right-handed hitters. The highest swing-and-miss percentages are also in those areas, as are the higher bat speeds. The results of the three balls put in play that you see were singles, two weak batted balls and Sheets’ line drive. This will be the biggest challenge for the Padres throughout the entire postseason, and there is a possibility that they will have to face Misiorowski twice. But there is a little bit of comfort here, and it is reasonable, since there is no fastball as dominant throughout the league as Miz’s, but there you can see how there are several Padres hitters who have been successful against that type of pitch. There are five hitters with an xSLG above .450, led by Fernando Tatis Jr. and Xander Bogaerts, who were surpassed only by James Wood (.775) of the Nationals. Rk Player B PA AB H 2B 3B HR RBI BB SO BA OBP SLG OPS SH SF IBB HBP GIDP 1 Xander Bogaerts R 3 3 0 0 0 0 0 0 1 .000 .000 .000 .000 0 0 0 0 0 2 Austin Hays R 3 3 2 0 0 0 0 0 0 .667 .667 .667 1.333 0 0 0 0 0 3 Manny Machado R 3 3 0 0 0 0 0 0 0 .000 .000 .000 .000 0 0 0 0 0 4 Jackson Merrill L 3 3 0 0 0 0 0 0 2 .000 .000 .000 .000 0 0 0 0 0 5 Gavin Sheets L 3 3 1 0 0 0 0 0 0 .333 .333 .333 .667 0 0 0 0 0 6 Fernando Tatis Jr. R 3 3 2 0 0 0 0 0 1 .667 .667 .667 1.333 0 0 0 0 0 7 Ty France R 2 2 1 0 0 0 0 0 1 .500 .500 .500 1.000 0 0 0 0 0 As you can see here, there are four hitters with at least one hit among the seven active players on this postseason roster who have faced Misiorowski, including Hays and Tatis Jr. going 2-for-3. Manny Machado is the only one who has struck out a couple of times, and the entire lineup combines for a .300/.300/.300 line, with no extra-base hits, five strikeouts and no walks. The past sample is small, and the challenge in this Game 1 is immense, so we will see if the Padres can have a chance against Misiorowski and change the dominant story from the regular season.
 -
To survive in October, it is clear that the San Diego Padres will not be able to do it without the consistency of their bullpen. The starting rotation is still full of questions behind Michael King, so the bullpen will have to be prepared to take on a large number of innings if the starters cannot provide enough durability. The questions become even more concerning when we remember that the Padres lost four of their five games against the Chicago Cubs during the regular season, allowing 55 runs, 18 home runs, a 9.23 ERA, and a .420 wOBA. Tm ROLE G IP ERA TBF H 2B 3B R ER HR BB IBB HBP SO AVG OBP SLG SDP RP 20 24 9.75 120 31 4 0 27 26 9 16 0 1 20 .304 .400 .608 SDP SP 6 27.2 8.78 135 34 5 0 28 27 9 16 1 3 22 .293 .393 .569 Both the starters and relievers were punished, but that trend was unusual when it comes to the Padres’ bullpen. There are several pitchers who faced the Cubs during the regular season and others who are no longer in the Padres’ bullpen and, although the samples were small, there are several interesting points to analyze. Pitcher G IP ERA TBF H R ER HR SO AVG OBP SLG wOBA O-Contact% Z-Contact% Hard% Mason Miller 3 2.2 6.75 13 5 2 2 0 2 .417 .462 .417 .396 50.0% 81.8% 30.0% JP Sears 1 4.2 11.57 25 8 7 6 3 4 .364 .440 .773 .508 83.3% 82.8% 50.0% Wandy Peralta 2 2.2 10.12 12 4 3 3 1 0 .364 .417 .636 .454 100.0% 93.8% 36.4% David Morgan 1 0.2 13.50 4 1 1 1 0 1 .333 .500 .667 .490 0.0% 83.3% 0.0% Matt Waldron 1 5 5.40 22 6 3 3 1 1 .300 .364 .500 .377 58.3% 96.4% 15.8% Griffin Canning 1 4.1 4.15 20 5 2 2 0 3 .294 .400 .412 .366 42.9% 84.0% 28.6% Kyle Hart 3 3.1 18.90 19 4 8 7 3 6 .286 .421 .929 .518 0.0% 90.0% 55.6% Walker Buehler 2 8.2 11.42 45 10 11 11 3 10 .270 .400 .568 .410 60.9% 86.7% 44.4% Ron Marinaccio 2 3.2 4.91 19 4 2 2 2 2 .267 .421 .667 .456 57.1% 92.9% 30.8% Randy Vásquez 1 5 9.00 23 5 5 5 2 4 .250 .348 .550 .385 68.8% 89.5% 43.8% Jason Adam 3 3.1 5.40 14 3 2 2 1 3 .231 .286 .462 .323 37.5% 72.7% 44.4% Bradgley Rodriguez 2 2 0.00 10 2 0 0 0 2 .222 .300 .333 .285 33.3% 75.0% 0.0% Adrián Morejón 3 3.2 2.45 15 1 1 1 0 4 .083 .267 .167 .224 62.5% 89.5% 37.5% There are several alarms here. First of all, those terrible 13 matchups in which Mason Miller was bombarded by the Cubs, allowing a .396 wOBA, with just two strikeouts and an unusual 81.8% in-zone contact rate. But this has not just been a temporary streak, as Cubs hitters are batting .313/.378/.469 with a .847 OPS in 37 plate appearances against the All-Star closer. The statistics belong to Miller’s entire history against the hitters who have been on the Cubs’ roster this year. With the exception of Michael Busch and Miguel Amaya, all the other hitters on their roster who have faced him have collected at least one hit against Miller and, for being a small sample of matchups, several have had very good results against the best reliever in baseball. That said, most of the hits have been singles, and this year the hard-hit rate is just 30%. Even so, the mere fact that several hitters are putting the ball in play so frequently against Miller leaves us with an interesting situation that we should follow. Now, let’s keep something in mind. Miller relieved in three regular-season games against the Cubs, but he pitched only 2 2/3 innings. All three of his appearances came in the ninth, and he ran into trouble in two of them. On April 27 in San Diego, he entered with a 9-5 lead and allowed two runs in the ninth. In his last appearance, on June 29, he relieved Jason Adam in the ninth, but ended up allowing a walk-off single to Seiya Suzuki for Chicago’s 3-2 victory at Wrigley Field. Miller, of course, will have to make adjustments to secure those final outs as he has done throughout this season. But, to get to the right-hander, the Padres’ bullpen will have to battle the inconsistencies of the starters to carry the game into the eighth or ninth inning. For that reason, I still believe the biggest concern for the Padres will be the matchups in the middle of the game. And, for those moments, there are some pitchers who have been too vulnerable against Cubs hitters in their careers. T Pitcher PA AB H 2B 3B HR RBI BB SO BA OBP SLG OPS SO% BB% L Adrián Morejón 37 29 4 1 0 0 3 5 11 .138 .265 .172 .437 29.7% 13.5% L Wandy Peralta 66 59 11 1 0 2 6 6 11 .186 .258 .305 .563 16.7% 9.1% L Yuki Matsui 14 14 3 0 1 0 1 0 4 .214 .214 .357 .571 28.6% 0.0% R Jason Adam 44 37 8 1 0 1 2 5 11 .216 .302 .324 .627 25.0% 11.4% R Randy Vásquez 72 65 16 1 0 2 3 7 12 .246 .319 .354 .673 16.7% 9.7% R Bradgley Rodriguez 9 8 2 1 0 0 0 1 2 .250 .333 .375 .708 22.2% 11.1% R Griffin Canning 80 72 21 4 0 4 12 6 14 .292 .342 .514 .856 17.5% 7.5% R Mason Miller 37 32 10 2 0 1 4 4 9 .313 .378 .469 .847 24.3% 10.8% L Kyle Hart 27 18 7 1 0 3 9 8 7 .389 .577 .944 1.521 25.9% 29.6% The three most experienced left-handers in the bullpen—Adrián Morejón, Wandy Peralta and Yuki Matsui—have been among the most dominant arms against Cubs hitters. Pete Crow-Armstrong, Ian Happ, Michael Conforto and Michael Busch are a combined 1-for-16 with eight strikeouts and four walks against Morejón, who has allowed three RBIs without a hit. If we group Peralta and Matsui with Morejón, then the Cubs have a history of just .143/.246/.286 with a .531 OPS, only three extra-base hits, 14 strikeouts and six walks. Those only two home runs were hit by Crow-Armstrong off Peralta in five at-bats. As you can see, other right-handers such as Jason Adam, Randy Vásquez and Bradgley Rodriguez can also join the matchup strategy, as they have also been consistent. Either way, the Padres will have to make decisions about their rotation and determine which pitcher would move to reinforce the bullpen. They still have enough arms to try to stop the Cubs’ potent offense, but this will be one of the toughest tests this pitching staff has faced all year long. View full article
-
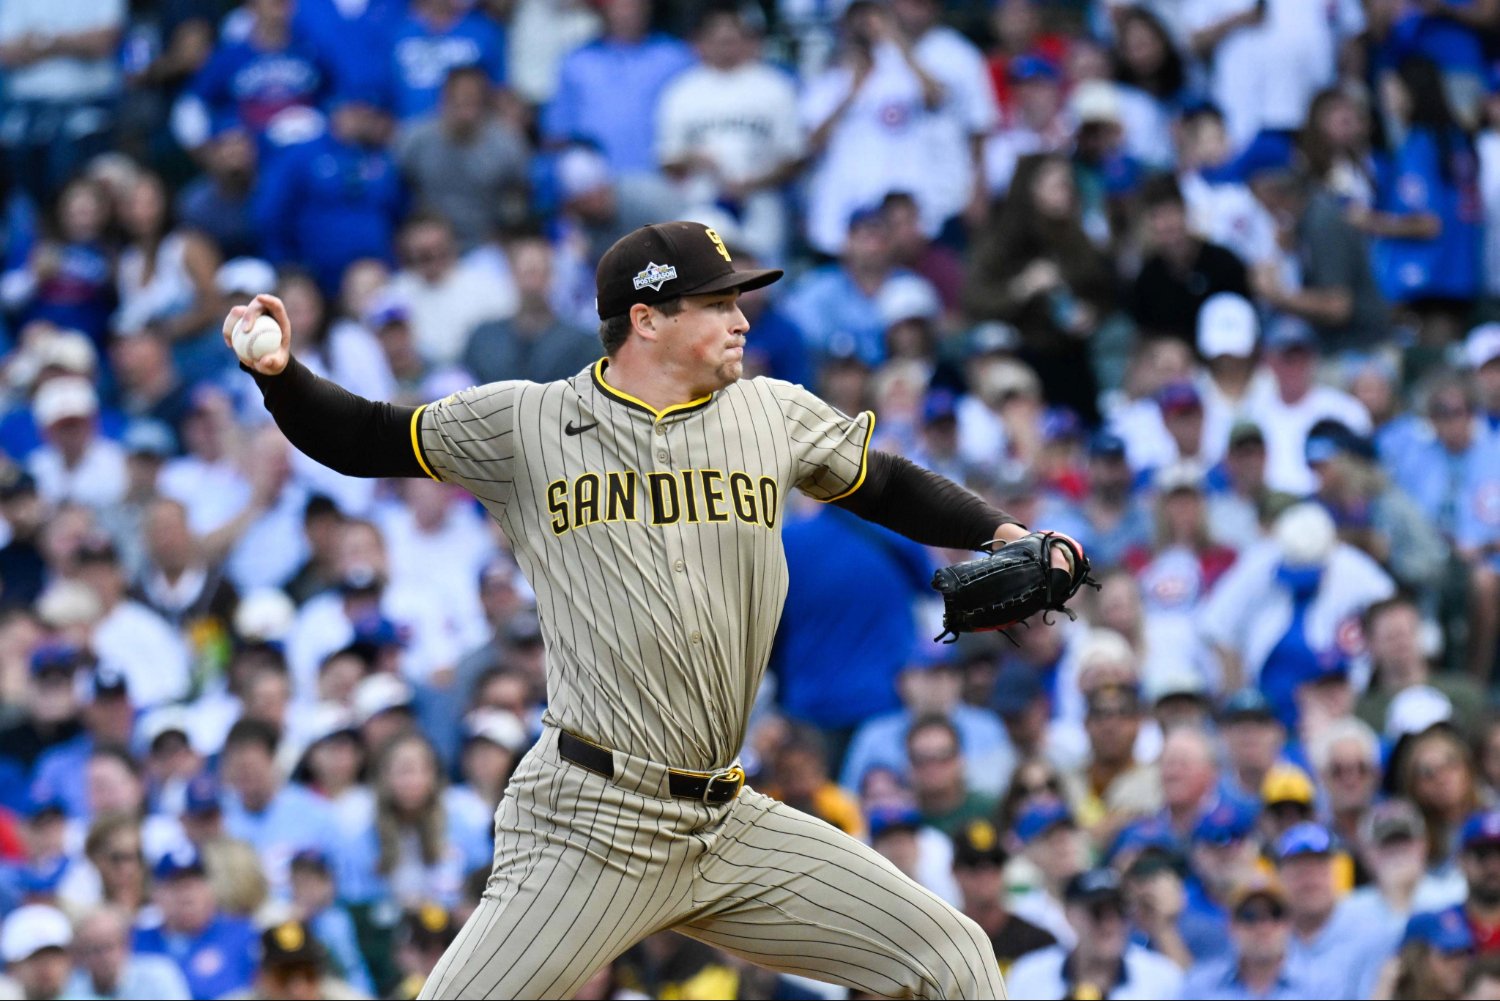 To survive in October, it is clear that the San Diego Padres will not be able to do it without the consistency of their bullpen. The starting rotation is still full of questions behind Michael King, so the bullpen will have to be prepared to take on a large number of innings if the starters cannot provide enough durability. The questions become even more concerning when we remember that the Padres lost four of their five games against the Chicago Cubs during the regular season, allowing 55 runs, 18 home runs, a 9.23 ERA, and a .420 wOBA. Tm ROLE G IP ERA TBF H 2B 3B R ER HR BB IBB HBP SO AVG OBP SLG SDP RP 20 24 9.75 120 31 4 0 27 26 9 16 0 1 20 .304 .400 .608 SDP SP 6 27.2 8.78 135 34 5 0 28 27 9 16 1 3 22 .293 .393 .569 Both the starters and relievers were punished, but that trend was unusual when it comes to the Padres’ bullpen. There are several pitchers who faced the Cubs during the regular season and others who are no longer in the Padres’ bullpen and, although the samples were small, there are several interesting points to analyze. Pitcher G IP ERA TBF H R ER HR SO AVG OBP SLG wOBA O-Contact% Z-Contact% Hard% Mason Miller 3 2.2 6.75 13 5 2 2 0 2 .417 .462 .417 .396 50.0% 81.8% 30.0% JP Sears 1 4.2 11.57 25 8 7 6 3 4 .364 .440 .773 .508 83.3% 82.8% 50.0% Wandy Peralta 2 2.2 10.12 12 4 3 3 1 0 .364 .417 .636 .454 100.0% 93.8% 36.4% David Morgan 1 0.2 13.50 4 1 1 1 0 1 .333 .500 .667 .490 0.0% 83.3% 0.0% Matt Waldron 1 5 5.40 22 6 3 3 1 1 .300 .364 .500 .377 58.3% 96.4% 15.8% Griffin Canning 1 4.1 4.15 20 5 2 2 0 3 .294 .400 .412 .366 42.9% 84.0% 28.6% Kyle Hart 3 3.1 18.90 19 4 8 7 3 6 .286 .421 .929 .518 0.0% 90.0% 55.6% Walker Buehler 2 8.2 11.42 45 10 11 11 3 10 .270 .400 .568 .410 60.9% 86.7% 44.4% Ron Marinaccio 2 3.2 4.91 19 4 2 2 2 2 .267 .421 .667 .456 57.1% 92.9% 30.8% Randy Vásquez 1 5 9.00 23 5 5 5 2 4 .250 .348 .550 .385 68.8% 89.5% 43.8% Jason Adam 3 3.1 5.40 14 3 2 2 1 3 .231 .286 .462 .323 37.5% 72.7% 44.4% Bradgley Rodriguez 2 2 0.00 10 2 0 0 0 2 .222 .300 .333 .285 33.3% 75.0% 0.0% Adrián Morejón 3 3.2 2.45 15 1 1 1 0 4 .083 .267 .167 .224 62.5% 89.5% 37.5% There are several alarms here. First of all, those terrible 13 matchups in which Mason Miller was bombarded by the Cubs, allowing a .396 wOBA, with just two strikeouts and an unusual 81.8% in-zone contact rate. But this has not just been a temporary streak, as Cubs hitters are batting .313/.378/.469 with a .847 OPS in 37 plate appearances against the All-Star closer. The statistics belong to Miller’s entire history against the hitters who have been on the Cubs’ roster this year. With the exception of Michael Busch and Miguel Amaya, all the other hitters on their roster who have faced him have collected at least one hit against Miller and, for being a small sample of matchups, several have had very good results against the best reliever in baseball. That said, most of the hits have been singles, and this year the hard-hit rate is just 30%. Even so, the mere fact that several hitters are putting the ball in play so frequently against Miller leaves us with an interesting situation that we should follow. Now, let’s keep something in mind. Miller relieved in three regular-season games against the Cubs, but he pitched only 2 2/3 innings. All three of his appearances came in the ninth, and he ran into trouble in two of them. On April 27 in San Diego, he entered with a 9-5 lead and allowed two runs in the ninth. In his last appearance, on June 29, he relieved Jason Adam in the ninth, but ended up allowing a walk-off single to Seiya Suzuki for Chicago’s 3-2 victory at Wrigley Field. Miller, of course, will have to make adjustments to secure those final outs as he has done throughout this season. But, to get to the right-hander, the Padres’ bullpen will have to battle the inconsistencies of the starters to carry the game into the eighth or ninth inning. For that reason, I still believe the biggest concern for the Padres will be the matchups in the middle of the game. And, for those moments, there are some pitchers who have been too vulnerable against Cubs hitters in their careers. T Pitcher PA AB H 2B 3B HR RBI BB SO BA OBP SLG OPS SO% BB% L Adrián Morejón 37 29 4 1 0 0 3 5 11 .138 .265 .172 .437 29.7% 13.5% L Wandy Peralta 66 59 11 1 0 2 6 6 11 .186 .258 .305 .563 16.7% 9.1% L Yuki Matsui 14 14 3 0 1 0 1 0 4 .214 .214 .357 .571 28.6% 0.0% R Jason Adam 44 37 8 1 0 1 2 5 11 .216 .302 .324 .627 25.0% 11.4% R Randy Vásquez 72 65 16 1 0 2 3 7 12 .246 .319 .354 .673 16.7% 9.7% R Bradgley Rodriguez 9 8 2 1 0 0 0 1 2 .250 .333 .375 .708 22.2% 11.1% R Griffin Canning 80 72 21 4 0 4 12 6 14 .292 .342 .514 .856 17.5% 7.5% R Mason Miller 37 32 10 2 0 1 4 4 9 .313 .378 .469 .847 24.3% 10.8% L Kyle Hart 27 18 7 1 0 3 9 8 7 .389 .577 .944 1.521 25.9% 29.6% The three most experienced left-handers in the bullpen—Adrián Morejón, Wandy Peralta and Yuki Matsui—have been among the most dominant arms against Cubs hitters. Pete Crow-Armstrong, Ian Happ, Michael Conforto and Michael Busch are a combined 1-for-16 with eight strikeouts and four walks against Morejón, who has allowed three RBIs without a hit. If we group Peralta and Matsui with Morejón, then the Cubs have a history of just .143/.246/.286 with a .531 OPS, only three extra-base hits, 14 strikeouts and six walks. Those only two home runs were hit by Crow-Armstrong off Peralta in five at-bats. As you can see, other right-handers such as Jason Adam, Randy Vásquez and Bradgley Rodriguez can also join the matchup strategy, as they have also been consistent. Either way, the Padres will have to make decisions about their rotation and determine which pitcher would move to reinforce the bullpen. They still have enough arms to try to stop the Cubs’ potent offense, but this will be one of the toughest tests this pitching staff has faced all year long.
 -
Manny Machado’s last two postseasons as a whole have been disappointing. In 40 plate appearances, he hit .158/.200/.342 with just a 51 wRC+ and a .542 OPS. Even so, he has had a couple of key moments, such as the two-run double that put the San Diego Padres ahead 3-1 in the second inning of Game 2 of the 2024 Wild Card Series against the Braves, and the two-run home run that increased the lead to 3-0 over the Cubs in the fifth inning of Game 2 of last year’s Wild Card Series. His best year in the playoffs since arriving in San Diego was in 2022, when he unleashed his power and hit four home runs and scored seven runs in 12 games. Two of those home runs were key to driving the Padres forward. First, the home run against Clayton Kershaw that opened Game 2 of the NLDS, in a series the Padres ended up winning 3-1 over the Dodgers in four games. Then, in the NLCS, he hit a solo home run in the first inning of Game 4 against the Phillies, which sparked a four-run rally after two outs. The four home runs Machado hit in that 2022 playoff run tied the franchise record for a single postseason, and his seven extra-base hits were the most in Padres history for a single year in the playoffs. However, over 51 postseason games, Machado has fallen short of expectations, producing a .209/.259/.423 offensive line, with a .682 OPS and an 85 wRC+. Regarding his recent inconsistencies, there are several interesting trends that we should explore. Here we have one key point: His combined performance over the final month of the regular season, compared to his results in the postseason. Season PA O-Swing% Z-Swing% Swing% O-Contact% Z-Contact% BB% K% Hard% AVG OBP SLG OPS wRC+ SEP/OCT (2024-2025) 291 28.9% 70.1% 51.7% 46.6% 84.0% 7.6% 22.7% 37.9% .230 .285 .457 .742 105 POSTSEASON (2024-2025) 40 39.8% 77.6% 57.3% 51.4% 81.4% 5.0% 30.0% 50.0% .158 .200 .342 .542 51 The first thing that catches my attention is how his aggressiveness at the plate spikes, taking many more swings and chasing more pitches outside the zone. This, without a doubt, is the fundamental part that has led him to strike out much more frequently, but his 12.1 percentage-point improvement in Hard% also stands out. His ground-ball rate also drops, so most of the balls put in play remain fly balls, but his averages show that those hard-hit balls have not made the difference. His slugging has seen a .115-point drop and OPS a .200 drop, which obviously includes his problems with taking walks and getting on base. Although there is nothing closer to the version of Machado we will see in the playoffs than the trends from his final month, it is worth highlighting that his swing was productive during the regular season against Cubs pitching. In 21 plate appearances, he produced a .300/.333/.600 offensive line with a 156 wRC+. His hard contact rate was 46.7% and that sounds great, but what is most concerning here is that an extreme pull hitter like the third baseman recorded a 26.7 Pull% rate, the lowest among Padres hitters with at least 20 plate appearances against Chicago. Machado chased 45.7% of the pitches against Cubs pitchers and, at times, what could be worse, made contact on 50.0% of his swings outside the zone. In the end, as we have seen here, that contact produced limited impact for the Friars. As you can see here, the Cubs have precisely marked where they want to pitch to the All-Star. Most of the pitches were outside the strike zone, well away, inside and outside in the lower part of the zone, and the lowest percentage, just 1.3%, has been on pitches middle-middle. In other words, his pitch selection will be key this series, as he will need a balance between being aggressive and much more patient, since in October every pitch and every swing decision can open up a range of possibilities. The Cubs will almost certainly draw up a similar strategy again. Perhaps this statistic explains it all: in 51 postseason games and 218 plate appearances, Manny has recorded just one game with two or more walks, when he received three walks in Game 3 of the NLDS against the Dodgers in 2022. His career BB/K rate has been 0.47, with 1,576 strikeouts and 739 walks, but in the postseason, it drops to 0.23. Plate discipline has been an important part of his offensive problems in the playoffs and has limited his ability to contribute as much as has been expected of him. Many times under the pressure of October, drawing a walk can become a key plate appearance, rather than failing in the attempt to try to solve everything with one swing. For Machado, deciding when to cross that thin line inside the batter’s box could lead to big results for the Padres this postseason. View full article
-
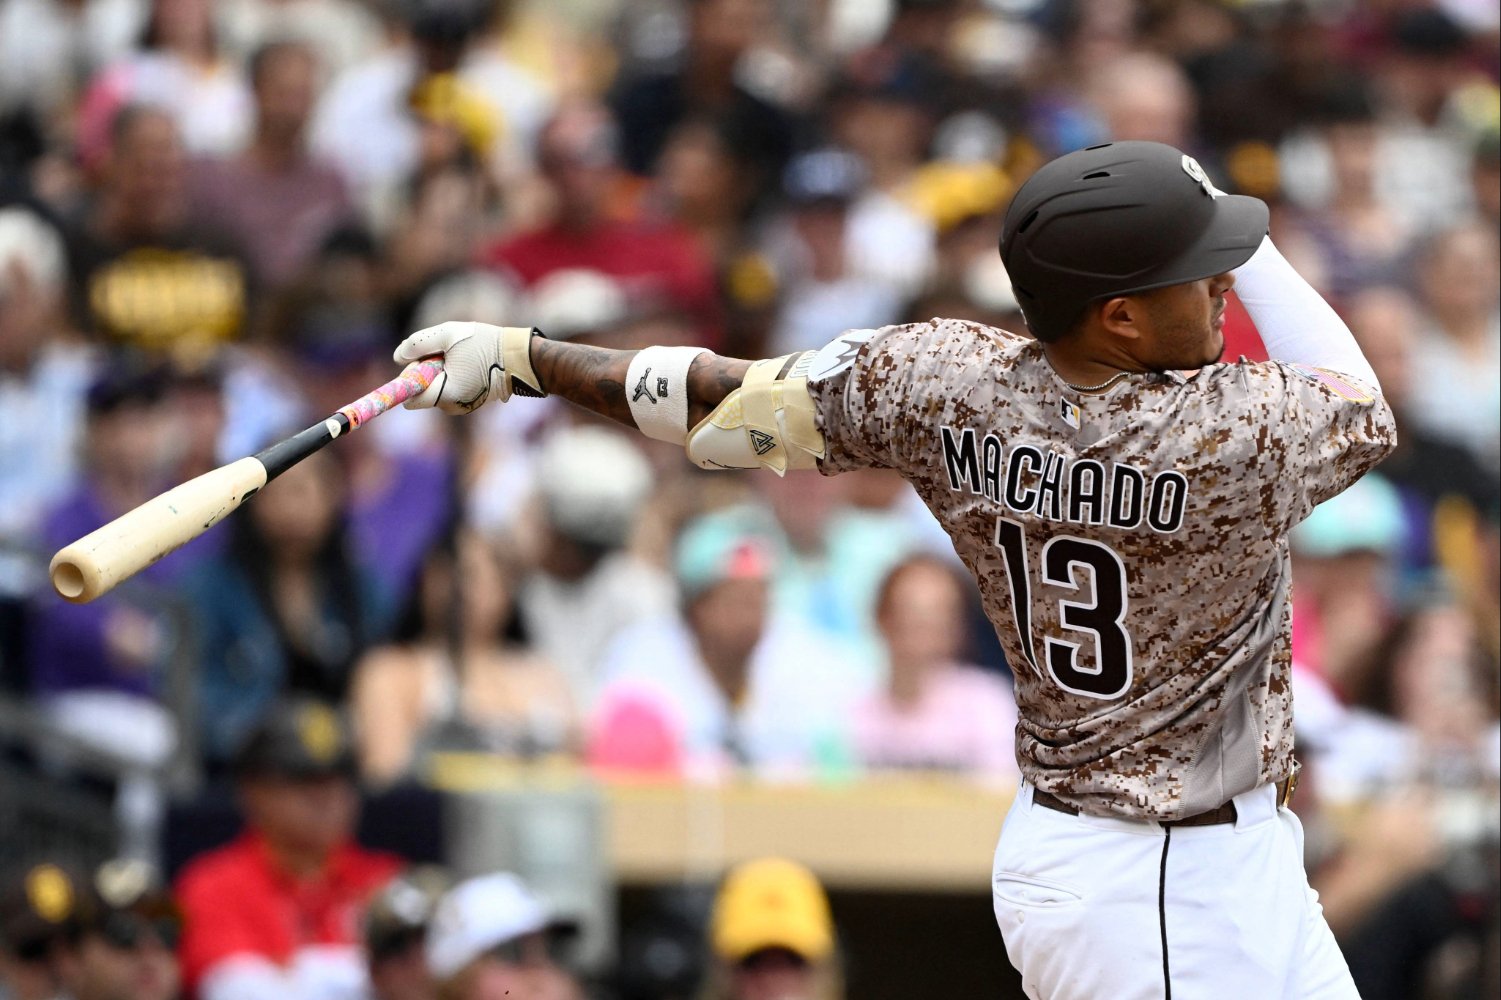 Manny Machado’s last two postseasons as a whole have been disappointing. In 40 plate appearances, he hit .158/.200/.342 with just a 51 wRC+ and a .542 OPS. Even so, he has had a couple of key moments, such as the two-run double that put the San Diego Padres ahead 3-1 in the second inning of Game 2 of the 2024 Wild Card Series against the Braves, and the two-run home run that increased the lead to 3-0 over the Cubs in the fifth inning of Game 2 of last year’s Wild Card Series. His best year in the playoffs since arriving in San Diego was in 2022, when he unleashed his power and hit four home runs and scored seven runs in 12 games. Two of those home runs were key to driving the Padres forward. First, the home run against Clayton Kershaw that opened Game 2 of the NLDS, in a series the Padres ended up winning 3-1 over the Dodgers in four games. Then, in the NLCS, he hit a solo home run in the first inning of Game 4 against the Phillies, which sparked a four-run rally after two outs. The four home runs Machado hit in that 2022 playoff run tied the franchise record for a single postseason, and his seven extra-base hits were the most in Padres history for a single year in the playoffs. However, over 51 postseason games, Machado has fallen short of expectations, producing a .209/.259/.423 offensive line, with a .682 OPS and an 85 wRC+. Regarding his recent inconsistencies, there are several interesting trends that we should explore. Here we have one key point: His combined performance over the final month of the regular season, compared to his results in the postseason. Season PA O-Swing% Z-Swing% Swing% O-Contact% Z-Contact% BB% K% Hard% AVG OBP SLG OPS wRC+ SEP/OCT (2024-2025) 291 28.9% 70.1% 51.7% 46.6% 84.0% 7.6% 22.7% 37.9% .230 .285 .457 .742 105 POSTSEASON (2024-2025) 40 39.8% 77.6% 57.3% 51.4% 81.4% 5.0% 30.0% 50.0% .158 .200 .342 .542 51 The first thing that catches my attention is how his aggressiveness at the plate spikes, taking many more swings and chasing more pitches outside the zone. This, without a doubt, is the fundamental part that has led him to strike out much more frequently, but his 12.1 percentage-point improvement in Hard% also stands out. His ground-ball rate also drops, so most of the balls put in play remain fly balls, but his averages show that those hard-hit balls have not made the difference. His slugging has seen a .115-point drop and OPS a .200 drop, which obviously includes his problems with taking walks and getting on base. Although there is nothing closer to the version of Machado we will see in the playoffs than the trends from his final month, it is worth highlighting that his swing was productive during the regular season against Cubs pitching. In 21 plate appearances, he produced a .300/.333/.600 offensive line with a 156 wRC+. His hard contact rate was 46.7% and that sounds great, but what is most concerning here is that an extreme pull hitter like the third baseman recorded a 26.7 Pull% rate, the lowest among Padres hitters with at least 20 plate appearances against Chicago. Machado chased 45.7% of the pitches against Cubs pitchers and, at times, what could be worse, made contact on 50.0% of his swings outside the zone. In the end, as we have seen here, that contact produced limited impact for the Friars. As you can see here, the Cubs have precisely marked where they want to pitch to the All-Star. Most of the pitches were outside the strike zone, well away, inside and outside in the lower part of the zone, and the lowest percentage, just 1.3%, has been on pitches middle-middle. In other words, his pitch selection will be key this series, as he will need a balance between being aggressive and much more patient, since in October every pitch and every swing decision can open up a range of possibilities. The Cubs will almost certainly draw up a similar strategy again. Perhaps this statistic explains it all: in 51 postseason games and 218 plate appearances, Manny has recorded just one game with two or more walks, when he received three walks in Game 3 of the NLDS against the Dodgers in 2022. His career BB/K rate has been 0.47, with 1,576 strikeouts and 739 walks, but in the postseason, it drops to 0.23. Plate discipline has been an important part of his offensive problems in the playoffs and has limited his ability to contribute as much as has been expected of him. Many times under the pressure of October, drawing a walk can become a key plate appearance, rather than failing in the attempt to try to solve everything with one swing. For Machado, deciding when to cross that thin line inside the batter’s box could lead to big results for the Padres this postseason.
 -
No team really has a way to control the pace. Over a long season, you never know how they will arrive in October in terms of rhythm and injuries. The mere fact of being able to compete in September should be a reason for celebration for many organizations. But there are others that were built to reach the postseason stage, and the San Diego Padres have been one of them. Nothing less was expected, and the way they are playing baseball at the doorstep of the playoffs has raised expectations even further. It is almost certain that the Padres will face the Chicago Cubs in one of the National League Wild Card Series, an opponent who has given them lots of trouble recently. Chicago has won five of six games this season while posting an enormous +27 run differential. That would not be an ideal matchup given the strength of their offense. But even if they dodge that bullet as the Cubs quietly collapse down the stretch, there are some pressing questions this team must answer before officially starting their quest for a World Series trophy. Let’s break down some of the most important ones. Who should be the Game 2 starter after Michael King? Let’s start at the beginning of the chaos. When the trade deadline ended, this question seemed less complicated. The Padres reinforced themselves with 2021 American League Cy Young winner Robbie Ray and All-Star Casey Mize. Both arrived in San Diego with the goal of aiding a rotation besieged injuries that was surviving thanks to the great strength and durability of the bullpen. Even so, Padres starters posted a 4.62 xFIP and 4.3 fWAR in 112 starts during the first half of the season. The numbers have worsened to a 4.70 ERA and only 1.6 fWAR since. The two arms that were expected to be a strength have been precisely the most vulnerable. In 17 starts, Mize and Ray have combined for –0.5 fWAR, a 5-5 record and a 5.72 ERA with 55 strikeouts, 43 walks and 17 home runs allowed. Only five of the 17 starts have been quality starts, and thanks to the Padres’ dominant relief corps, those numbers have not looked worse in the final results of the games. In Mize’s nine starts, the Padres are 6-3 and have been able to salvage two of the outings in which he allowed at least four runs. Ray, although he has also been bombarded, has at least recorded five innings in six of his eight starts. His status as a left-hander could also fit against lineups with several left-handed hitters like the Cubs, but with what we have seen from both pitchers, the Padres will have to decide whether they feel comfortable trusting either in a short series. So, it is very likely that Walker Buehler or Nick Pivetta will compete for that spot as the Game 2 starter. Pivetta just returned from the injured list and had not pitched since April, but he has looked good in his return with a pair of wins and a 1.93 ERA in three starts. I don’t think Pivetta is a bad option for Game 2 considering that the Padres have a deep bullpen, especially if they can get a deep start out of King in Game 1. But there is one factor that makes the difference: historically, he has pitched much better against the Cubs. Buehler is 1-4 with a 5.83 ERA in nine appearances—eight as a starter—against Chicago in his career. The situation has gotten worse this season, with a 0-1 record, an 11.42 ERA, three home runs and 11 runs allowed in just 8 2/3 innings. Five of the Cubs’ regular hitters have driven in at least two runs against Buehler and four have hit home runs: Dansby Swanson (2), Michael Conforto (2), Seiya Suzuki and Miguel Amaya. Pivetta, on the other hand, has fared better. He is 2-2 with a 3.96 ERA and has recorded at least five innings in four of his five starts. The last time he faced Chicago in the regular season was in April 2025, when he pitched six innings of one-run ball to earn the Padres’ 4-2 victory. He followed that up with a strong outing (two earned runs over five innings) in last year's Wild Card Round. Again, Swanson and Conforto appear in the matchups with two home runs each, but among them only Ian Happ (3-for-10 with a double and six strikeouts) and Carson Kelly (3-for-6, triple and RBI with three strikeouts) have been able to produce against Pivetta’s pitches. Pivetta appears to be the best option here, unless the Padres decide otherwise against the dangerous Cubs lineup that has been relentless against them this year. Is Jake Cronenworth Worthy of Starting Every Day? In many offensive terms, Jake Cronenworth has not had a more puzzling season than this one. His power had disappeared along with a sudden lack of quality contact. In a way, that can be forgivable in a hitter, and some good at-bats can hide those problems when those hits change the course of games. Cronenworth has never been known as the type of hitter made for clutch moments, but when his swing is right and he does not chase too much, he often shows up. He is getting it done these days after a completely quiet first half of the season. In high-leverage situations, Cronenworth has a career 91 wRC+, so it was inevitable to be surprised by his –12 wRC+ in the first part of the season. It’s not that he has been that good in those situations since the All-Star break, but he has a 77 wRC+, his OPS has risen from .259 to .623, and he finally broke out of his puzzling power outage in clutch moments. After dropping from a 119 wRC+ in July to 75 in August, Cronenworth’s swing has produced a 101 mark this September and he is at his best point of the season combining contact and power. He should probably be in the lineup in every postseason game the Friars play, barring a particularly tough matchup. Are Dustin Harris and Samad Taylor ready to overcome the pressure of the postseason? The answer for the Padres could be in the rhythm Cronenworth can maintain, and how much they are willing to risk defensively for Gavin Sheets’ bat. Both Taylor and Harris have been revelations who have brought contact and speed to the lineup. The metrics have Taylor at –2 Fielding Run Value, the same as Cronenworth, while Sheets has –4 and the worst range of the entire Padres' defense this year. Harris has the best numbers among them, but he is still an average fielder. So, the Padres have to decide which formula could work best. If they keep Cronenworth at second base with his range issues to preserve his bat in case he stays hot, the only consolation at this point is that he has been a better contact hitter against left-handed pitchers. The other option is to bring Fernando Tatis Jr. to second base, as they have also experimented with recently, and keep Harris in right field. The other decision would be who remains the starter in left field, but I don’t think there is much discussion at this point considering the way Taylor is playing. With Tatis at second base, the Padres would have one of the best defensive infields we could see in these playoffs, and the all-important defensive equation would be much more fortified. Over the last few weeks, Cronenworth has appeared at every infield position, which seems like a preview of the role he will have. In the postseason, every pitch, every out and every detail counts. So, finding the best initial defensive setup could be the key, and something I love about these Padres is that they have the versatility to make any number of combinations work. View full article
-
Three Burning Questions Padres Must Answer Before Wild Card Round
Yirsandy Rodríguez posted an article in Padres
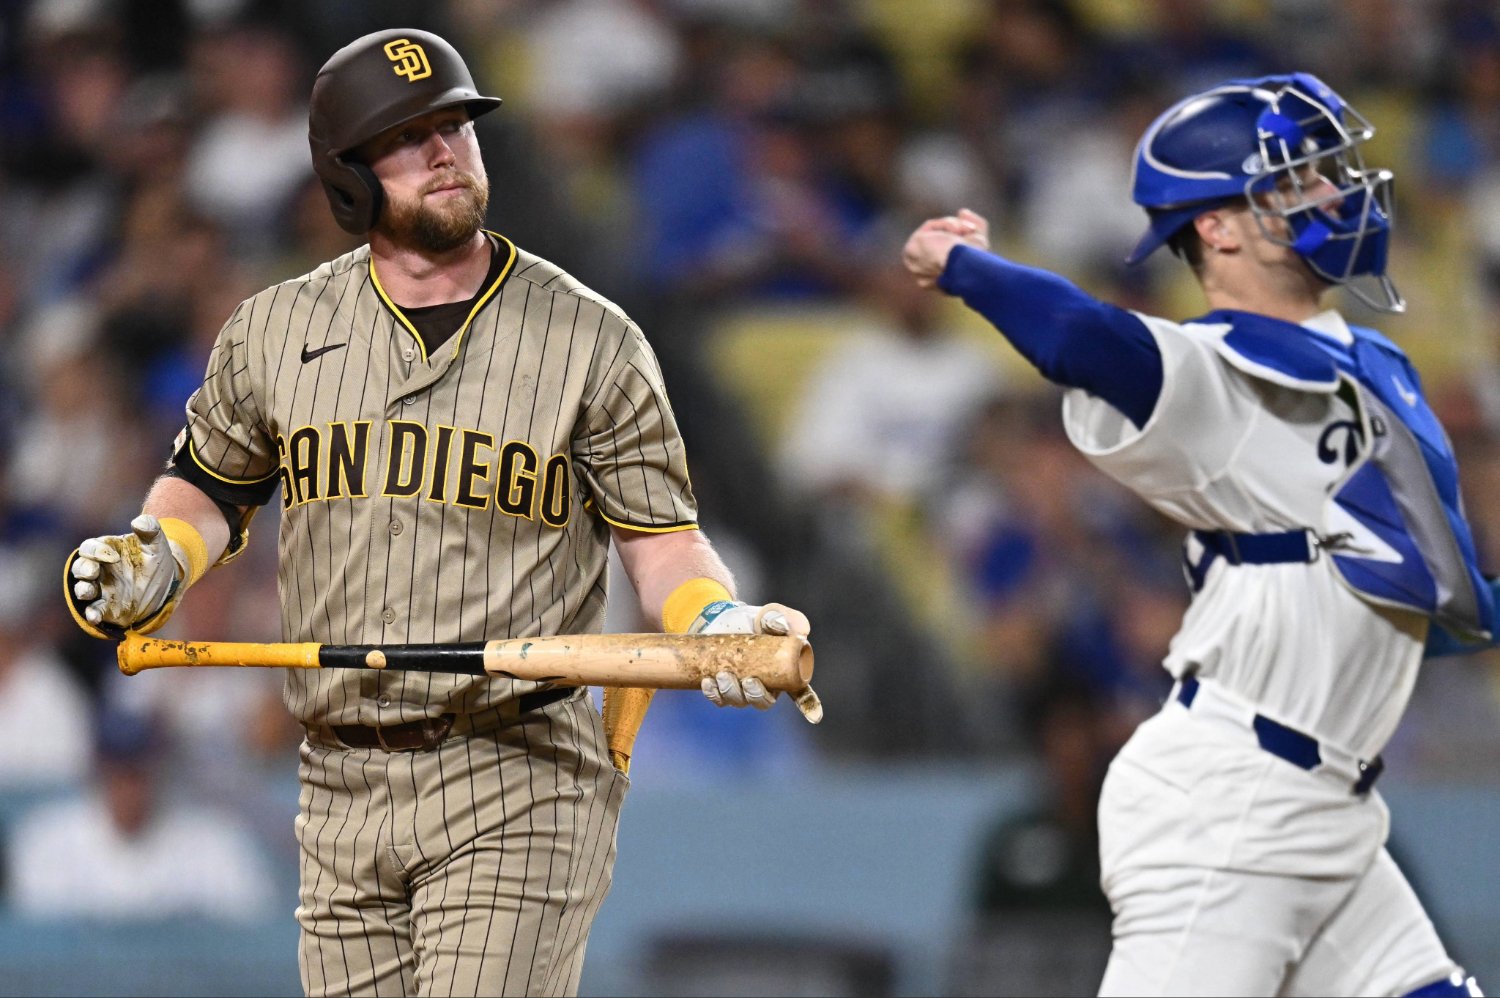 No team really has a way to control the pace. Over a long season, you never know how they will arrive in October in terms of rhythm and injuries. The mere fact of being able to compete in September should be a reason for celebration for many organizations. But there are others that were built to reach the postseason stage, and the San Diego Padres have been one of them. Nothing less was expected, and the way they are playing baseball at the doorstep of the playoffs has raised expectations even further. It is almost certain that the Padres will face the Chicago Cubs in one of the National League Wild Card Series, an opponent who has given them lots of trouble recently. Chicago has won five of six games this season while posting an enormous +27 run differential. That would not be an ideal matchup given the strength of their offense. But even if they dodge that bullet as the Cubs quietly collapse down the stretch, there are some pressing questions this team must answer before officially starting their quest for a World Series trophy. Let’s break down some of the most important ones. Who should be the Game 2 starter after Michael King? Let’s start at the beginning of the chaos. When the trade deadline ended, this question seemed less complicated. The Padres reinforced themselves with 2021 American League Cy Young winner Robbie Ray and All-Star Casey Mize. Both arrived in San Diego with the goal of aiding a rotation besieged injuries that was surviving thanks to the great strength and durability of the bullpen. Even so, Padres starters posted a 4.62 xFIP and 4.3 fWAR in 112 starts during the first half of the season. The numbers have worsened to a 4.70 ERA and only 1.6 fWAR since. The two arms that were expected to be a strength have been precisely the most vulnerable. In 17 starts, Mize and Ray have combined for –0.5 fWAR, a 5-5 record and a 5.72 ERA with 55 strikeouts, 43 walks and 17 home runs allowed. Only five of the 17 starts have been quality starts, and thanks to the Padres’ dominant relief corps, those numbers have not looked worse in the final results of the games. In Mize’s nine starts, the Padres are 6-3 and have been able to salvage two of the outings in which he allowed at least four runs. Ray, although he has also been bombarded, has at least recorded five innings in six of his eight starts. His status as a left-hander could also fit against lineups with several left-handed hitters like the Cubs, but with what we have seen from both pitchers, the Padres will have to decide whether they feel comfortable trusting either in a short series. So, it is very likely that Walker Buehler or Nick Pivetta will compete for that spot as the Game 2 starter. Pivetta just returned from the injured list and had not pitched since April, but he has looked good in his return with a pair of wins and a 1.93 ERA in three starts. I don’t think Pivetta is a bad option for Game 2 considering that the Padres have a deep bullpen, especially if they can get a deep start out of King in Game 1. But there is one factor that makes the difference: historically, he has pitched much better against the Cubs. Buehler is 1-4 with a 5.83 ERA in nine appearances—eight as a starter—against Chicago in his career. The situation has gotten worse this season, with a 0-1 record, an 11.42 ERA, three home runs and 11 runs allowed in just 8 2/3 innings. Five of the Cubs’ regular hitters have driven in at least two runs against Buehler and four have hit home runs: Dansby Swanson (2), Michael Conforto (2), Seiya Suzuki and Miguel Amaya. Pivetta, on the other hand, has fared better. He is 2-2 with a 3.96 ERA and has recorded at least five innings in four of his five starts. The last time he faced Chicago in the regular season was in April 2025, when he pitched six innings of one-run ball to earn the Padres’ 4-2 victory. He followed that up with a strong outing (two earned runs over five innings) in last year's Wild Card Round. Again, Swanson and Conforto appear in the matchups with two home runs each, but among them only Ian Happ (3-for-10 with a double and six strikeouts) and Carson Kelly (3-for-6, triple and RBI with three strikeouts) have been able to produce against Pivetta’s pitches. Pivetta appears to be the best option here, unless the Padres decide otherwise against the dangerous Cubs lineup that has been relentless against them this year. Is Jake Cronenworth Worthy of Starting Every Day? In many offensive terms, Jake Cronenworth has not had a more puzzling season than this one. His power had disappeared along with a sudden lack of quality contact. In a way, that can be forgivable in a hitter, and some good at-bats can hide those problems when those hits change the course of games. Cronenworth has never been known as the type of hitter made for clutch moments, but when his swing is right and he does not chase too much, he often shows up. He is getting it done these days after a completely quiet first half of the season. In high-leverage situations, Cronenworth has a career 91 wRC+, so it was inevitable to be surprised by his –12 wRC+ in the first part of the season. It’s not that he has been that good in those situations since the All-Star break, but he has a 77 wRC+, his OPS has risen from .259 to .623, and he finally broke out of his puzzling power outage in clutch moments. After dropping from a 119 wRC+ in July to 75 in August, Cronenworth’s swing has produced a 101 mark this September and he is at his best point of the season combining contact and power. He should probably be in the lineup in every postseason game the Friars play, barring a particularly tough matchup. Are Dustin Harris and Samad Taylor ready to overcome the pressure of the postseason? The answer for the Padres could be in the rhythm Cronenworth can maintain, and how much they are willing to risk defensively for Gavin Sheets’ bat. Both Taylor and Harris have been revelations who have brought contact and speed to the lineup. The metrics have Taylor at –2 Fielding Run Value, the same as Cronenworth, while Sheets has –4 and the worst range of the entire Padres' defense this year. Harris has the best numbers among them, but he is still an average fielder. So, the Padres have to decide which formula could work best. If they keep Cronenworth at second base with his range issues to preserve his bat in case he stays hot, the only consolation at this point is that he has been a better contact hitter against left-handed pitchers. The other option is to bring Fernando Tatis Jr. to second base, as they have also experimented with recently, and keep Harris in right field. The other decision would be who remains the starter in left field, but I don’t think there is much discussion at this point considering the way Taylor is playing. With Tatis at second base, the Padres would have one of the best defensive infields we could see in these playoffs, and the all-important defensive equation would be much more fortified. Over the last few weeks, Cronenworth has appeared at every infield position, which seems like a preview of the role he will have. In the postseason, every pitch, every out and every detail counts. So, finding the best initial defensive setup could be the key, and something I love about these Padres is that they have the versatility to make any number of combinations work.
 -
For a pitcher, problems are not always just in the execution of his pitches. San Diego Padres right-hander Randy Vásquez embodies that truth. He seems like he can exhibit a more dominant version of himself at times, and then you get periods of collapse like he had at the end of May. After beating the Seattle Mariners with six scoreless innings and just four hits allowed in a 2-0 victory on May 15, he could not secure at least six innings again in his next 12 appearances, four of them as a reliever. The Padres decided to remove him from the starting rotation and Vásquez entered one of the worst stretches of his career. In his 11 outings from May 20 through July 25, he went 1-5, 7.20 ERA, 6.72 FIP with 10 home runs allowed and a 1.12 K/BB rate. When we analyze his repertoire, his curveball was the most vulnerable pitch. Between April and July, batters hit .309 xBA with .440 xSLG. The story repeated itself, as in 2025 Vásquez allowed a .497 xSLG and .486 in 2024 when he threw his curveball. By gaining almost 3 mph of velocity in 2026, from 81.2 to 84.0 mph, his curve lost vertical drop, going from 48.1 to 41.8 inches. That evolution did not favor Vásquez, who depended too much on his most vulnerable pitch. Then, the Padres fixed it. In the most recent stretch, since July 30, Vásquez has made 10 outings. He returned to the starting rotation and is 4-0, 2.76 ERA, 3.40 FIP and has accumulated a hold. He has allowed only two home runs against 162 opponents and his K/BB rose to 2.5, surpassing his career average (1.88). The key was in the utilization of his repertoire. He began throwing fewer curveballs and more sinkers in pressure counts. Against left-handed hitters, with the batter ahead in the count, he eliminated the curveball and increased his attack with the sinker from 4% to 36%. When the at-bat reaches the finish in two strikes, he still uses the curveball against left-handed hitters, but dropped from 33% to 8%, and has placed more of his trust in the sinker, from 5% to 28%. Now comes the most interesting part of that new strategy: the batters, who had hit .385 in the first stretch between May 20 and July 25, saw their average against the sinker fall from .385 to .200 and their slugging from .539 to .255. Vásquez was throwing the sinker in fewer favorable counts, but even though the samples were small, there are considerable differences in terms of dominance. In the graph on the left, which corresponds to the first period we have analyzed here, Vásquez was hit through the middle vertical part of the zone, but in the second period his sinker has done more damage against the opposition. He is still in danger when he stays high in the strike zone, but in the middle and on the outside corner it has been lethal against left-handed hitters, achieving the effect that the curveball had not been able to. Another one of the adjustments within Vásquez’s mix is in his use of the cutter, which he is now using more frequently to open the count against right-handed hitters, going from 30% to 45%. It took away prominence from the fastball and the cutter has also improved in the decisions of the at-bats. In the first stretch, the cutter allowed a .405 average and .905 slugging, but Vásquez has limited hitters since, leaving them at marks of just .130 and .217, respectively. He has also turned it into a more effective weapon for generating swings and misses, improving almost twice as much in whiffs%, from 13.0% to 24.6%. Pitch Type 05/20/2026 to 07/25/2026 07/30/2026 to 09/15/2026 BAA SLG Whiff/Swing GB/BIP BAA SLG Whiff/Swing GB/BIP Four-seam .289 .444 18.4 20.5 .158 .290 17.2 30.3 Sinker .385 .539 9.3 43.5 .200 .255 6.9 51.0 Change .333 .444 7.7 33.3 .211 .316 26.7 75.0 Slider .444 .889 13.3 14.3 .500 1.000 0.0 33.3 Curve .378 .600 13.8 50.0 .083 .083 17.4 70.0 Cutter .405 .905 13.0 23.8 .130 .217 24.6 44.4 Here is Randy Vásquez’s recent improvement, summarized in two key changes: fewer hard-hit balls and home runs allowed. He has limited contact and the adjustment in his pitch mix is giving him the possibility of generating more swings and misses. He is also increasing his ground-ball rate with all his pitches, another turning point in his favor as he continues to recover his ability to strike hitters out. All these adjustments by Vásquez have come at a key moment of the season, while the Padres continue to wait for the consistency and durability of Casey Mize and Robbie Ray, who have not found their best form after joining the team at the trade deadline. If this continues, we could see Vásquez handle some extremely important innings in October, either as a starter or reliever. View full article
-
Randy Vásquez Is Back On the Upswing With Padres At the Perfect Time
Yirsandy Rodríguez posted an article in Padres
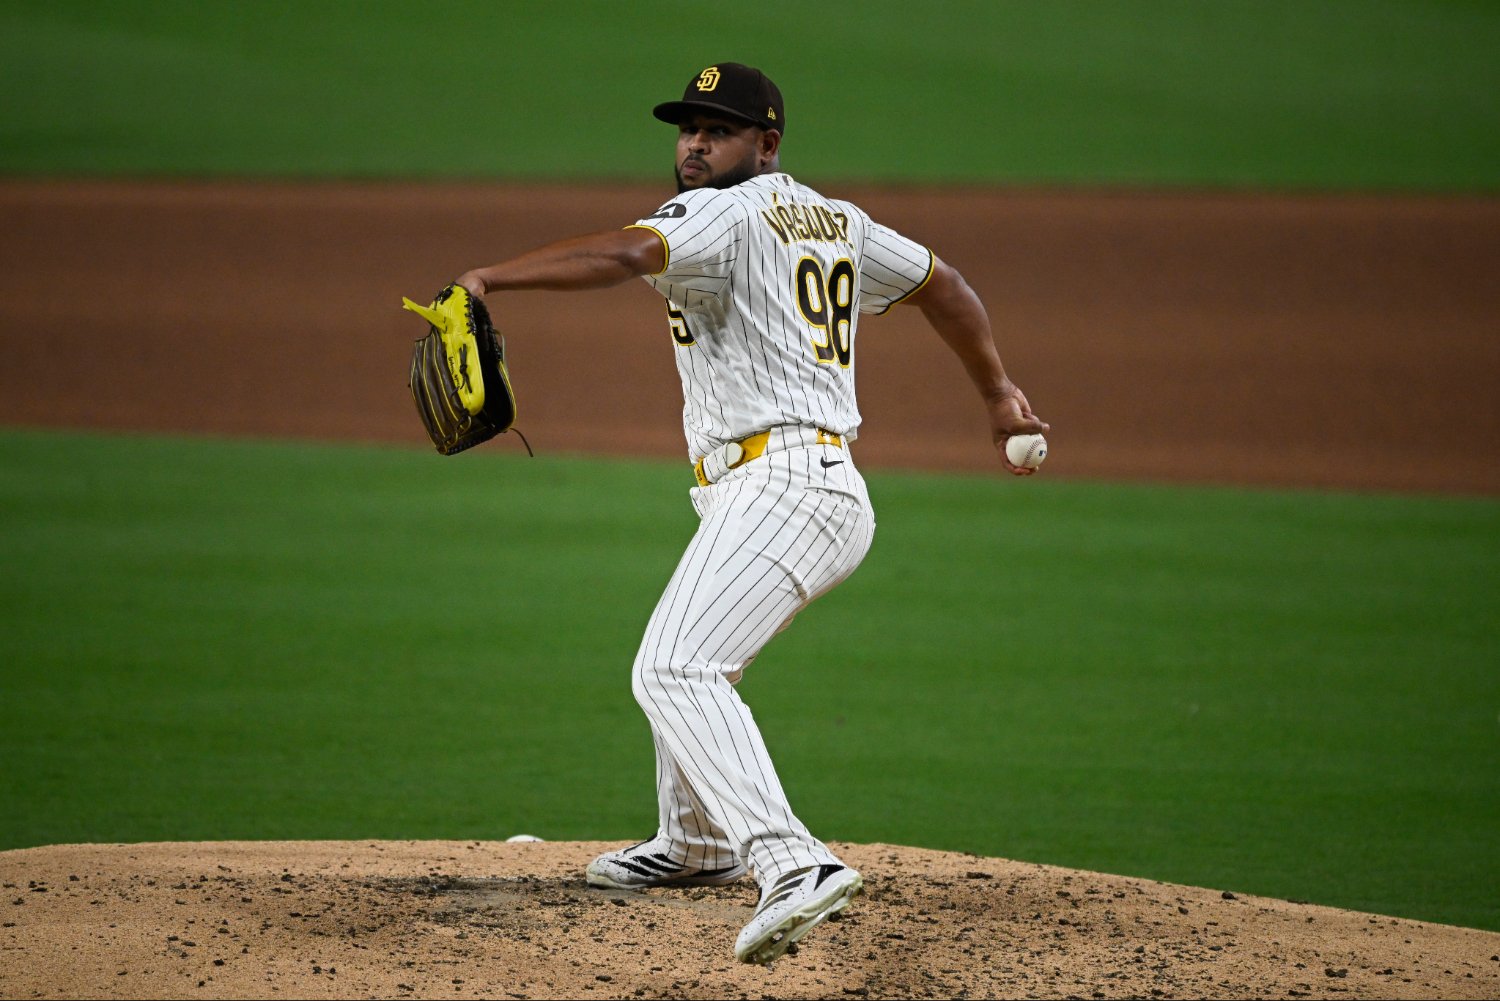 For a pitcher, problems are not always just in the execution of his pitches. San Diego Padres right-hander Randy Vásquez embodies that truth. He seems like he can exhibit a more dominant version of himself at times, and then you get periods of collapse like he had at the end of May. After beating the Seattle Mariners with six scoreless innings and just four hits allowed in a 2-0 victory on May 15, he could not secure at least six innings again in his next 12 appearances, four of them as a reliever. The Padres decided to remove him from the starting rotation and Vásquez entered one of the worst stretches of his career. In his 11 outings from May 20 through July 25, he went 1-5, 7.20 ERA, 6.72 FIP with 10 home runs allowed and a 1.12 K/BB rate. When we analyze his repertoire, his curveball was the most vulnerable pitch. Between April and July, batters hit .309 xBA with .440 xSLG. The story repeated itself, as in 2025 Vásquez allowed a .497 xSLG and .486 in 2024 when he threw his curveball. By gaining almost 3 mph of velocity in 2026, from 81.2 to 84.0 mph, his curve lost vertical drop, going from 48.1 to 41.8 inches. That evolution did not favor Vásquez, who depended too much on his most vulnerable pitch. Then, the Padres fixed it. In the most recent stretch, since July 30, Vásquez has made 10 outings. He returned to the starting rotation and is 4-0, 2.76 ERA, 3.40 FIP and has accumulated a hold. He has allowed only two home runs against 162 opponents and his K/BB rose to 2.5, surpassing his career average (1.88). The key was in the utilization of his repertoire. He began throwing fewer curveballs and more sinkers in pressure counts. Against left-handed hitters, with the batter ahead in the count, he eliminated the curveball and increased his attack with the sinker from 4% to 36%. When the at-bat reaches the finish in two strikes, he still uses the curveball against left-handed hitters, but dropped from 33% to 8%, and has placed more of his trust in the sinker, from 5% to 28%. Now comes the most interesting part of that new strategy: the batters, who had hit .385 in the first stretch between May 20 and July 25, saw their average against the sinker fall from .385 to .200 and their slugging from .539 to .255. Vásquez was throwing the sinker in fewer favorable counts, but even though the samples were small, there are considerable differences in terms of dominance. In the graph on the left, which corresponds to the first period we have analyzed here, Vásquez was hit through the middle vertical part of the zone, but in the second period his sinker has done more damage against the opposition. He is still in danger when he stays high in the strike zone, but in the middle and on the outside corner it has been lethal against left-handed hitters, achieving the effect that the curveball had not been able to. Another one of the adjustments within Vásquez’s mix is in his use of the cutter, which he is now using more frequently to open the count against right-handed hitters, going from 30% to 45%. It took away prominence from the fastball and the cutter has also improved in the decisions of the at-bats. In the first stretch, the cutter allowed a .405 average and .905 slugging, but Vásquez has limited hitters since, leaving them at marks of just .130 and .217, respectively. He has also turned it into a more effective weapon for generating swings and misses, improving almost twice as much in whiffs%, from 13.0% to 24.6%. Pitch Type 05/20/2026 to 07/25/2026 07/30/2026 to 09/15/2026 BAA SLG Whiff/Swing GB/BIP BAA SLG Whiff/Swing GB/BIP Four-seam .289 .444 18.4 20.5 .158 .290 17.2 30.3 Sinker .385 .539 9.3 43.5 .200 .255 6.9 51.0 Change .333 .444 7.7 33.3 .211 .316 26.7 75.0 Slider .444 .889 13.3 14.3 .500 1.000 0.0 33.3 Curve .378 .600 13.8 50.0 .083 .083 17.4 70.0 Cutter .405 .905 13.0 23.8 .130 .217 24.6 44.4 Here is Randy Vásquez’s recent improvement, summarized in two key changes: fewer hard-hit balls and home runs allowed. He has limited contact and the adjustment in his pitch mix is giving him the possibility of generating more swings and misses. He is also increasing his ground-ball rate with all his pitches, another turning point in his favor as he continues to recover his ability to strike hitters out. All these adjustments by Vásquez have come at a key moment of the season, while the Padres continue to wait for the consistency and durability of Casey Mize and Robbie Ray, who have not found their best form after joining the team at the trade deadline. If this continues, we could see Vásquez handle some extremely important innings in October, either as a starter or reliever.
 -
The doubts surrounding Casey Mize are impossible to hide and are generating more concerns as the postseason approaches. The pitcher who seemed like a revelation when the Detroit Tigers needed him most in the first half of the season has fallen off in this second stretch. = The problems began right when he arrived in San Diego at the trade deadline. Since then, Mize has been unable to make the turnaround that is expected. The opposition is managing to hit his pitches inside the strike zone 10.1% more, and that impact has been key to raising the .601 OPS from the first half to a .821 OPS since the All-Star break. The Mize of the almost unhittable arsenal with fastball, slider, slurve and split finger who moved through lineups between April and July has now seen his K/BB rate pulverized with a puzzling 11.1% drop. Since arriving in San Diego, the Padres have modified the way he uses his repertoire depending on the hitter’s handedness and the count situation. Between June and July, Mize’s sinker and slider had a slight decline in their expected metrics, and that may have alerted the Friars' coaching staff. In a way, there have been some interesting improvements that we will explore here, even though the overall results still do not show them. The most interesting question (with the playoffs in mind) is whether the Padres really found a structure that can make the right-hander more effective. Situation vs. LHH before vs. LHH SD vs. RHH before vs. RHH SD All counts — Splitter 29% 35% 16% 8% All counts — Slider 28% 27% 24% 36% All counts — Sinker 1% 0% 25% 15% Two strikes — Splitter 40% 49% 24% 19% Two strikes — Four-seam 38% 41% 27% 45% The changes show that San Diego is trying to get Mize to change the attack with his pitches depending on the matchup and the moment of the at-bat. Against left-handed hitters, Mize saw his K/9 fall in July to his worst rate of the entire season. So the splitter, with which he recorded 52% of his strikeouts, went from 29% to 35% usage. With the change, it is acquiring more importance when he has the advantage in the count, from 44% to 51% when he is ahead, and from 40% to 49% in two-strike counts. Against right-handers, the adjustment is different. The slider went from 24% to 36% overall usage, while the sinker fell from 25% to 15%. And when he gets to two strikes, the four-seam fastball went from 27% to 45%. The splitter is where the plan with the Padres is finding the most interesting results. Splitter August September BA .333 .176 SLG .481 .176 EV 84.3 mph 80.9 mph Whiff 11.1% 38.9% PutAway 8.3% 25.0% The formula is beginning to give results beyond just whiff rates. The splitter is limiting the impact on all the important indicators, and PutAway% reveals that Mize is using it in more decisive situations. Continuing with the adjustments, the slider presents a different evolution, but also a relevant one. In August, it allowed a .412 batting average, .647 slugging and .445 wOBA. In September, those numbers have fallen to .273, .364 and .276. The whiff rate, however, barely changed: 17.1% in August versus 17.9% in September. The improvement of the slider has been reflected more against right-handers, but Mize has had inconsistencies against left-handers, allowing .539 slugging in 13 at-bats. It is a small sample that we still have to follow, because before arriving in San Diego they had hit .182 against him in 44 at-bats. Finally, let's analyze what the four-seam fastball brings us. Four-seam August September BA .179 .261 SLG .462 .565 EV 93.8 mph 95.0 mph Whiffs 5.7% 9.5% PutAway 11.6% 18.5% In this month of September, Mize has not been able to continue with the adjustments from August, but he has generated more swings-and-misses and finished at-bats with more strikeouts. For that reason, the monthly change is not enough to define it as a weak point within the new plan. The most interesting question appears when we observe what is happening according to the hitter’s handedness. Four-seam with Padres LHB RHB K% 19.4% 21.9% Whiffs 4.7% 11.7% BAA .209 .138 SLG .328 .310 GB/BIP 21.8% 9.0% There are two key details here: the batting averages have gone down, but it has not been because Mize is finding more vulnerable points to generate swings and misses. In fact, if we analyze his profile overall, we can see that his Flawed Swing% with the fastball has fallen from 3% to 0% since he arrived in San Diego. Of course, he can be dominant without generating flawed swings, but when you reach the point of barely getting any, it is obvious that hitters are not feeling surprised and probably are not even concerned with the fastball or the environment in which he is throwing it. Now, what is positive is that the dominance is coming through a reduction in contact quality. Against right-handers, the fastball is allowing just a .138 batting average, despite generating a meager 11.7% whiff rate. Against left-handers, that falls even further to 4.7%, but the ground-ball rate rises to 21.8%, an important point in Mize’s favor. As revealing as the samples are, we still need to see many more adjustments, as Mize continues to be unable to find a consistent finish to the at-bats in his favor. The postseason is getting closer and closer, and the Padres need the dominant Mize from the first half of the season to survive a brutal National League gauntlet. It's a question of if he can put everything together in time October. View full article
