


Yirsandy Rodríguez
-
Posts
70 -
Joined
-
Last visited
Content Type
Profiles
San Diego Padres Videos
2026 San Diego Padres Top Prospects Ranking
San Diego Padres Free Agent & Trade Rumors, Notes, & Tidbits
Guides & Resources
2025 San Diego Padres Draft Pick Tracker
News
2026 San Diego Padres Draft Tracker: Picks & Bonuses
Forums
Blogs
Events
Store
Downloads
Gallery
Everything posted by Yirsandy Rodríguez
-

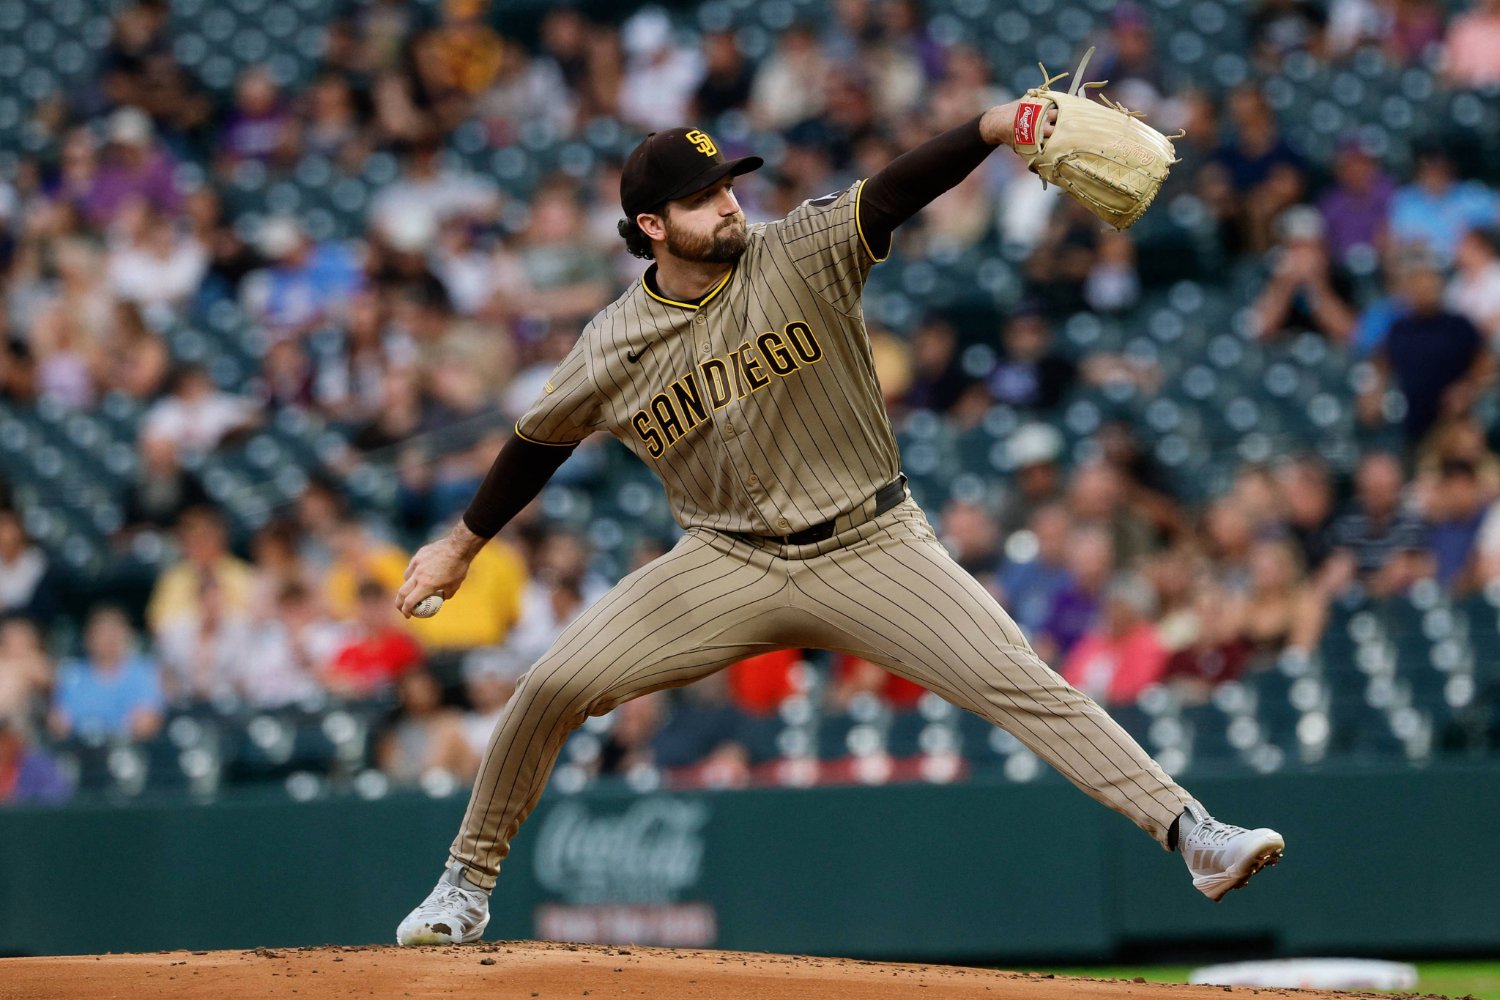 The doubts surrounding Casey Mize are impossible to hide and are generating more concerns as the postseason approaches. The pitcher who seemed like a revelation when the Detroit Tigers needed him most in the first half of the season has fallen off in this second stretch. = The problems began right when he arrived in San Diego at the trade deadline. Since then, Mize has been unable to make the turnaround that is expected. The opposition is managing to hit his pitches inside the strike zone 10.1% more, and that impact has been key to raising the .601 OPS from the first half to a .821 OPS since the All-Star break. The Mize of the almost unhittable arsenal with fastball, slider, slurve and split finger who moved through lineups between April and July has now seen his K/BB rate pulverized with a puzzling 11.1% drop. Since arriving in San Diego, the Padres have modified the way he uses his repertoire depending on the hitter’s handedness and the count situation. Between June and July, Mize’s sinker and slider had a slight decline in their expected metrics, and that may have alerted the Friars' coaching staff. In a way, there have been some interesting improvements that we will explore here, even though the overall results still do not show them. The most interesting question (with the playoffs in mind) is whether the Padres really found a structure that can make the right-hander more effective. Situation vs. LHH before vs. LHH SD vs. RHH before vs. RHH SD All counts — Splitter 29% 35% 16% 8% All counts — Slider 28% 27% 24% 36% All counts — Sinker 1% 0% 25% 15% Two strikes — Splitter 40% 49% 24% 19% Two strikes — Four-seam 38% 41% 27% 45% The changes show that San Diego is trying to get Mize to change the attack with his pitches depending on the matchup and the moment of the at-bat. Against left-handed hitters, Mize saw his K/9 fall in July to his worst rate of the entire season. So the splitter, with which he recorded 52% of his strikeouts, went from 29% to 35% usage. With the change, it is acquiring more importance when he has the advantage in the count, from 44% to 51% when he is ahead, and from 40% to 49% in two-strike counts. Against right-handers, the adjustment is different. The slider went from 24% to 36% overall usage, while the sinker fell from 25% to 15%. And when he gets to two strikes, the four-seam fastball went from 27% to 45%. The splitter is where the plan with the Padres is finding the most interesting results. Splitter August September BA .333 .176 SLG .481 .176 EV 84.3 mph 80.9 mph Whiff 11.1% 38.9% PutAway 8.3% 25.0% The formula is beginning to give results beyond just whiff rates. The splitter is limiting the impact on all the important indicators, and PutAway% reveals that Mize is using it in more decisive situations. Continuing with the adjustments, the slider presents a different evolution, but also a relevant one. In August, it allowed a .412 batting average, .647 slugging and .445 wOBA. In September, those numbers have fallen to .273, .364 and .276. The whiff rate, however, barely changed: 17.1% in August versus 17.9% in September. The improvement of the slider has been reflected more against right-handers, but Mize has had inconsistencies against left-handers, allowing .539 slugging in 13 at-bats. It is a small sample that we still have to follow, because before arriving in San Diego they had hit .182 against him in 44 at-bats. Finally, let's analyze what the four-seam fastball brings us. Four-seam August September BA .179 .261 SLG .462 .565 EV 93.8 mph 95.0 mph Whiffs 5.7% 9.5% PutAway 11.6% 18.5% In this month of September, Mize has not been able to continue with the adjustments from August, but he has generated more swings-and-misses and finished at-bats with more strikeouts. For that reason, the monthly change is not enough to define it as a weak point within the new plan. The most interesting question appears when we observe what is happening according to the hitter’s handedness. Four-seam with Padres LHB RHB K% 19.4% 21.9% Whiffs 4.7% 11.7% BAA .209 .138 SLG .328 .310 GB/BIP 21.8% 9.0% There are two key details here: the batting averages have gone down, but it has not been because Mize is finding more vulnerable points to generate swings and misses. In fact, if we analyze his profile overall, we can see that his Flawed Swing% with the fastball has fallen from 3% to 0% since he arrived in San Diego. Of course, he can be dominant without generating flawed swings, but when you reach the point of barely getting any, it is obvious that hitters are not feeling surprised and probably are not even concerned with the fastball or the environment in which he is throwing it. Now, what is positive is that the dominance is coming through a reduction in contact quality. Against right-handers, the fastball is allowing just a .138 batting average, despite generating a meager 11.7% whiff rate. Against left-handers, that falls even further to 4.7%, but the ground-ball rate rises to 21.8%, an important point in Mize’s favor. As revealing as the samples are, we still need to see many more adjustments, as Mize continues to be unable to find a consistent finish to the at-bats in his favor. The postseason is getting closer and closer, and the Padres need the dominant Mize from the first half of the season to survive a brutal National League gauntlet. It's a question of if he can put everything together in time October.
 -
The depth of the San Diego Padres’ bullpen continues to make the team one of the toughest contenders to overcome in a playoff series, especially if it is a series of fewer than seven games. There's enough elite arms to handle high-leverage pressure and often cover for the lack of depth among the starting pitchers. Behind the main names, left-hander Kyle Hart has emerged as another arm to keep an eye on. The southpaw has not allowed a run in 26 of his 40 relief appearances this year, has a 3.15 xERA and a 50.6 GB% rate. His ability to generate ground balls frequently and limit left-handed hitters has been one of the most attractive trends in his profile. He currently ranks in the 95th percentile in HardHit%, the 90th in GB%, and his sinker ranks in the 89th percentile in run value. Hart has not allowed a home run since July 4, a streak that extends to 112 batters faced. He has held left-handed hitters to a .652 OPS and has not allowed a home run against right-handed hitters, who are producing just a .605 OPS. Since the All-Star break, Hart’s adjustments have become much more noticeable in the Padres’ bullpen, which has the second-best xERA (1.77) in the league. Name SV G IP K/9 HR/9 GB% vFA (pi) FIP WAR Bradgley Rodriguez 2 20 21 12.0 0.4 47.3% 98.3 1.62 0.7 Kyle Hart 0 14 17.2 10.7 0.0 56.5% 93.8 1.91 0.5 Randy Vásquez 0 4 13.1 6.1 0.0 54.3% 94.9 2.20 0.3 Mason Miller 7 17 17.2 16.3 1.0 43.3% 101.6 2.30 0.6 Adrian Morejon 1 20 24.2 11.7 0.4 47.4% 99.2 2.73 0.6 Yuki Matsui 0 18 21.1 10.6 0.4 40.5% 91.8 2.91 0.4 Wandy Peralta 0 16 18 5.5 1.5 43.1% 95.8 4.54 0.0 Griffin Canning 0 10 17.2 9.2 2.0 47.2% 94.9 5.02 -0.1 Hart has the second-best FIP in the group, mostly because his pitches continue to generate ground balls at a massive rate. In the middle of this process, one of his key adjustments was turning the sinker into the primary weapon in his arsenal. Since June, it has become the most-used pitch in his repertoire, replacing the sweeper. The results have been highly revealing, limiting the opposition to a .233 xSLG, the lowest among any left-handed reliever in the game. Player PA xSLG xwOBA K% Hard Hit% Hader, Josh LHP 55 .265 .190 34.5% 40.0% Hart, Kyle LHP 35 .223 .225 34.3% 20.0% Miller, Erik LHP 48 .225 .247 22.9% 13.8% Sommers, Drew LHP 42 .229 .250 21.4% 25.0% Peralta, Wandy LHP 46 .324 .261 8.7% 37.5% Mayza, Tim LHP 41 .346 .270 19.5% 48.4% Bernardino, Brennan LHP 50 .354 .281 10.0% 35.7% Ashby, Aaron LHP 66 .326 .284 16.7% 42.9% Dodd, Dylan LHP 51 .386 .295 23.5% 45.5% Garcia, Brandyn LHP 38 .389 .303 15.8% 41.4% Morejon, Adrian LHP 63 .366 .319 14.3% 27.7% Suter, Brent LHP 50 .378 .321 14.0% 23.7% Hill, Tim LHP 74 .453 .342 4.1% 40.9% Bruihl, Justin LHP 59 .353 .343 8.5% 35.6% Alvarado, José LHP 60 .413 .376 10.0% 33.3% Soto, Gregory LHP 40 .456 .393 2.5% 34.4% Ferrer, José A. LHP 72 .537 .404 9.7% 43.1% Young, Danny LHP 37 .548 .425 13.5% 68.0% Moll, Sam LHP 39 .574 .456 10.3% 63.0% Hart stands out in this group of qualified left-handed relievers with at least 35 plate appearances ending with a sinker since June. He is not only leading with the lowest xSLG, but also ranks second in all the other metrics, alongside dominant left-handers who have had a great year such as Josh Hader and Erik Miller. Now, the point we should still keep an eye on is how Hart is responding in high-pressure situations. Combining his appearances with the tying run at the plate, the tying run on base and the tying run on deck, his .418 xSLG allowed is fairly similar to his .411 mark for the entire season, but his walk rate has jumped from 8.7% to 10.9%. His strikeout rate has similarly fallen from 23.2% to 13.0%. This is a total of 12 plate appearances, which, while not a large sample and something that can change with a few more matchups, reflects what middle relievers often face: one- or two-batter situations and, in Hart’s case, some lefty-on-lefty matchups that can result in key moments of a game. For his part, he has been reserved for those small moments of walking a tightrope. In 55% of his 40 relief appearances, he has faced five or fewer batters and, interestingly, in 55% of those 22 games, he has never gone beyond three hitters. For the Padres, it is an absolute relief to know that behind Mason Miller, Adrian Morejón, Bradgley Rodríguez, Yuki Matsui and Wandy Peralta, they have Kyle Hart’s left arm. Though he may not be a high-leverage savant, the Friars already have enough of those. More importantly, he adds quality depth to a bullpen that is poised to be worked hard through the end of the regular season and into October. View full article
-
Kyle Hart Is Just the Latest Successful Padres Bullpen Project
Yirsandy Rodríguez posted an article in Padres
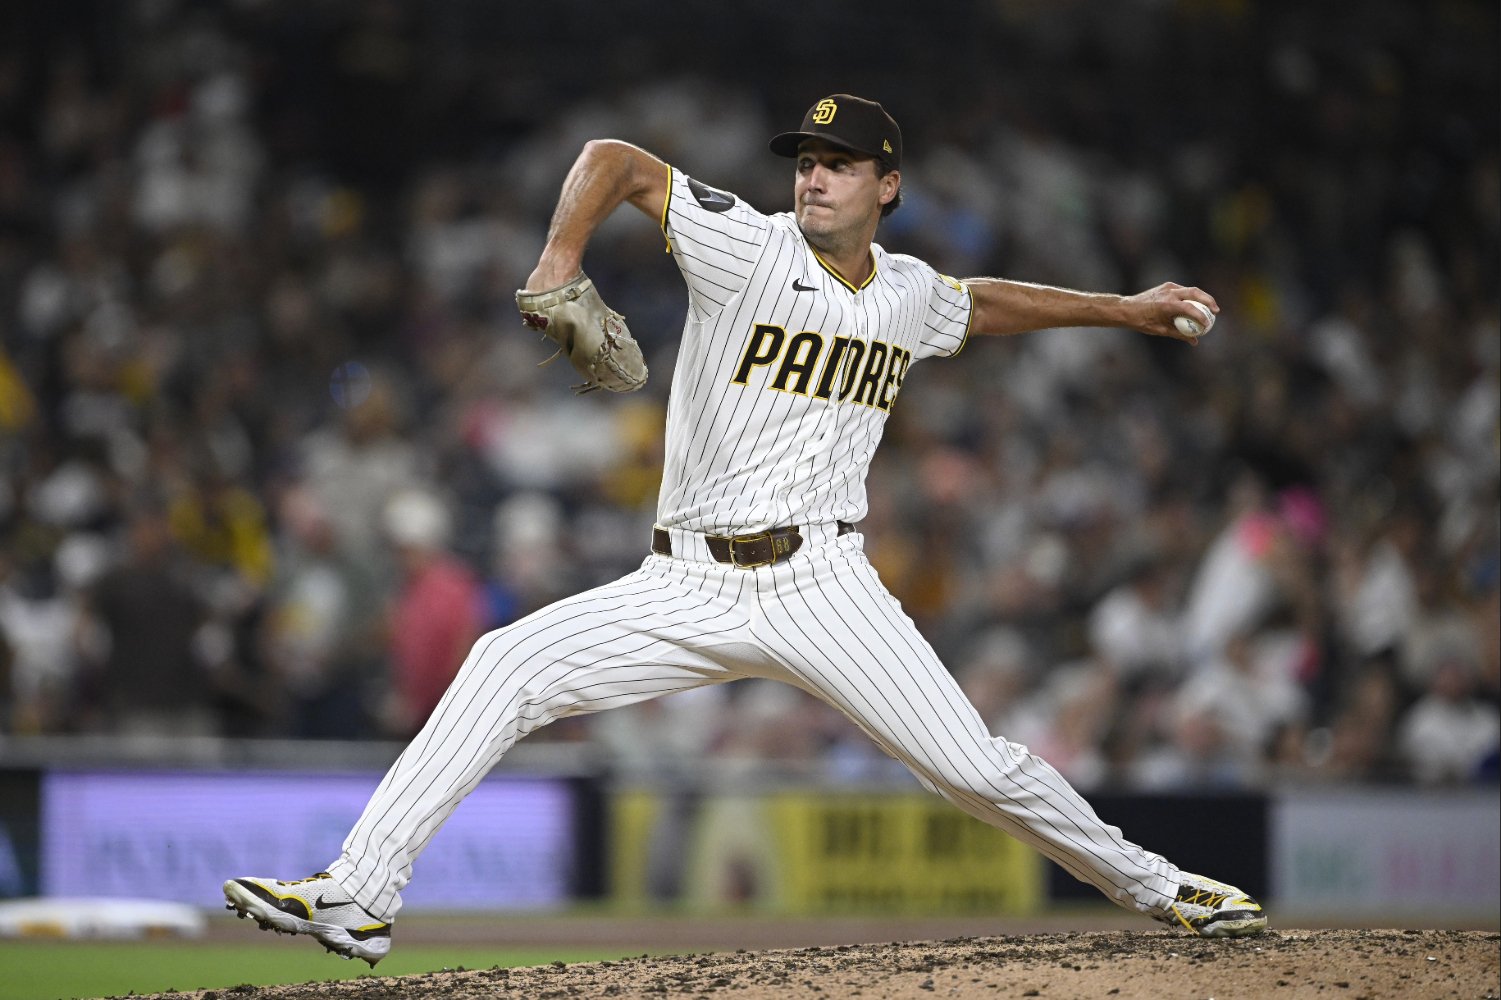 The depth of the San Diego Padres’ bullpen continues to make the team one of the toughest contenders to overcome in a playoff series, especially if it is a series of fewer than seven games. There's enough elite arms to handle high-leverage pressure and often cover for the lack of depth among the starting pitchers. Behind the main names, left-hander Kyle Hart has emerged as another arm to keep an eye on. The southpaw has not allowed a run in 26 of his 40 relief appearances this year, has a 3.15 xERA and a 50.6 GB% rate. His ability to generate ground balls frequently and limit left-handed hitters has been one of the most attractive trends in his profile. He currently ranks in the 95th percentile in HardHit%, the 90th in GB%, and his sinker ranks in the 89th percentile in run value. Hart has not allowed a home run since July 4, a streak that extends to 112 batters faced. He has held left-handed hitters to a .652 OPS and has not allowed a home run against right-handed hitters, who are producing just a .605 OPS. Since the All-Star break, Hart’s adjustments have become much more noticeable in the Padres’ bullpen, which has the second-best xERA (1.77) in the league. Name SV G IP K/9 HR/9 GB% vFA (pi) FIP WAR Bradgley Rodriguez 2 20 21 12.0 0.4 47.3% 98.3 1.62 0.7 Kyle Hart 0 14 17.2 10.7 0.0 56.5% 93.8 1.91 0.5 Randy Vásquez 0 4 13.1 6.1 0.0 54.3% 94.9 2.20 0.3 Mason Miller 7 17 17.2 16.3 1.0 43.3% 101.6 2.30 0.6 Adrian Morejon 1 20 24.2 11.7 0.4 47.4% 99.2 2.73 0.6 Yuki Matsui 0 18 21.1 10.6 0.4 40.5% 91.8 2.91 0.4 Wandy Peralta 0 16 18 5.5 1.5 43.1% 95.8 4.54 0.0 Griffin Canning 0 10 17.2 9.2 2.0 47.2% 94.9 5.02 -0.1 Hart has the second-best FIP in the group, mostly because his pitches continue to generate ground balls at a massive rate. In the middle of this process, one of his key adjustments was turning the sinker into the primary weapon in his arsenal. Since June, it has become the most-used pitch in his repertoire, replacing the sweeper. The results have been highly revealing, limiting the opposition to a .233 xSLG, the lowest among any left-handed reliever in the game. Player PA xSLG xwOBA K% Hard Hit% Hader, Josh LHP 55 .265 .190 34.5% 40.0% Hart, Kyle LHP 35 .223 .225 34.3% 20.0% Miller, Erik LHP 48 .225 .247 22.9% 13.8% Sommers, Drew LHP 42 .229 .250 21.4% 25.0% Peralta, Wandy LHP 46 .324 .261 8.7% 37.5% Mayza, Tim LHP 41 .346 .270 19.5% 48.4% Bernardino, Brennan LHP 50 .354 .281 10.0% 35.7% Ashby, Aaron LHP 66 .326 .284 16.7% 42.9% Dodd, Dylan LHP 51 .386 .295 23.5% 45.5% Garcia, Brandyn LHP 38 .389 .303 15.8% 41.4% Morejon, Adrian LHP 63 .366 .319 14.3% 27.7% Suter, Brent LHP 50 .378 .321 14.0% 23.7% Hill, Tim LHP 74 .453 .342 4.1% 40.9% Bruihl, Justin LHP 59 .353 .343 8.5% 35.6% Alvarado, José LHP 60 .413 .376 10.0% 33.3% Soto, Gregory LHP 40 .456 .393 2.5% 34.4% Ferrer, José A. LHP 72 .537 .404 9.7% 43.1% Young, Danny LHP 37 .548 .425 13.5% 68.0% Moll, Sam LHP 39 .574 .456 10.3% 63.0% Hart stands out in this group of qualified left-handed relievers with at least 35 plate appearances ending with a sinker since June. He is not only leading with the lowest xSLG, but also ranks second in all the other metrics, alongside dominant left-handers who have had a great year such as Josh Hader and Erik Miller. Now, the point we should still keep an eye on is how Hart is responding in high-pressure situations. Combining his appearances with the tying run at the plate, the tying run on base and the tying run on deck, his .418 xSLG allowed is fairly similar to his .411 mark for the entire season, but his walk rate has jumped from 8.7% to 10.9%. His strikeout rate has similarly fallen from 23.2% to 13.0%. This is a total of 12 plate appearances, which, while not a large sample and something that can change with a few more matchups, reflects what middle relievers often face: one- or two-batter situations and, in Hart’s case, some lefty-on-lefty matchups that can result in key moments of a game. For his part, he has been reserved for those small moments of walking a tightrope. In 55% of his 40 relief appearances, he has faced five or fewer batters and, interestingly, in 55% of those 22 games, he has never gone beyond three hitters. For the Padres, it is an absolute relief to know that behind Mason Miller, Adrian Morejón, Bradgley Rodríguez, Yuki Matsui and Wandy Peralta, they have Kyle Hart’s left arm. Though he may not be a high-leverage savant, the Friars already have enough of those. More importantly, he adds quality depth to a bullpen that is poised to be worked hard through the end of the regular season and into October.
 -
If we stop only at Walker Buehler’s 4.66 ERA, it would be enough to worry us down the stretch, with the San Diego Padres fighting for a Wild Card spot. I don’t like to blame ERA, though, since no statistic can tell the entire story of a pitcher in a single number. Buehler’s case is very interesting. Despite his high ERA, the Padres are 18-9 in games he has started. If we take away his three worst consecutive starts of the entire season, when he allowed 20 runs in 11 innings between July 1 and July 11, his ERA drops to 3.59. At that point, it gets pretty close to the 3.19 ERA he has posted over 42 ⅓ innings in his last eight starts. His inconsistencies in July reflected the problems that have followed the right-hander: his inability to stay ahead in the count and the problems that have affected his fastball and changeup. As the season has progressed, his strategy has changed. In April, the slider was his main weapon under pressure in decisive counts. Then, the sweeper took that place. In June, he switched to the cutter. In July, he went back to the slider after allowing three home runs and a .758 xSLG with the changeup. In August, his knuckle curve took control, while the sinker returned to dominating. In August, hitters posted a 32.7 O-Swing% against Buehler, his highest rate in any month this season. The overall results were encouraging, as he allowed the second-lowest wOBA (.308) of the entire year—only behind the .305 he allowed in June. But nothing summarizes Buehler’s season as a starter this year better than his performances when the pressure is highest. That was one of his best characteristics as a Dodgers pitcher, and it still seems that he can get an extra gear in the biggest moments. I extended the research I started when I wrote about Michael King’s improvements last week, and Buehler’s results really surprised me. I chose only the games involving teams that, if the regular season ended today, would have secured a direct postseason or Wild Card spot in the National League. They would be: the Milwaukee Brewers, Los Angeles Dodgers, Atlanta Braves, Chicago Cubs, Philadelphia Phillies and San Diego Padres. I chose all the games between them and filtered for pitchers who have faced at least 120 batters. There are 16 pitchers who meet that criterion. Take a look at the xFIP leaders: Jacob Misiorowski (MIL), 2.34 Chris Sale (ATL), 2.58 Yoshinobu Yamamoto (LAD), 2.64 Cristopher Sánchez (PHI), 2.71 Kyle Harrison (MIL), 3.44 Michael King (SDP), 3.71 Shota Imanaga (CHC), 3.71 Bryce Elder (ATL), 3.71 Most of the Game 1 postseason starters are in that top eight. There are other pitchers like Zack Wheeler (3.45) and Shane Drohan (3.19) who have been dominant, but they did not qualify because they have not faced enough batters. Now comes the point that will probably surprise you. Among so many top-level pitchers, Buehler also has a place when it comes to pitching under pressure. Name Tm G IP TBF AVG BABIP K-BB% HR/FB ERA xERA xFIP Jacob Misiorowski MIL 7 46 168 .151 .235 30.4% 2.6% 0.78 1.67 2.34 Walker Buehler SDP 7 37 155 .188 .214 7.7% 9.1% 4.38 4.03 4.98 Yoshinobu Yamamoto LAD 7 44 2/3 171 .192 .265 23.4% 10.7% 1.21 2.81 2.64 Chris Sale ATL 8 52 2/3 207 .201 .291 28.5% 4.3% 1.37 2.45 2.58 Michael King SDP 6 36 148 .206 .281 14.9% 0.0% 2.00 3.47 3.71 Justin Wrobleski LAD 7 43 1/3 180 .220 .232 17.2% 17.9% 5.19 4.40 4.08 Kyle Harrison MIL 7 37 2/3 157 .248 .281 22.9% 20.0% 3.82 3.15 3.44 Emmet Sheehan LAD 6 29 2/3 126 .250 .311 20.6% 13.5% 4.25 3.47 3.82 Bryce Elder ATL 5 30 2/3 131 .262 .309 13.0% 10.7% 4.70 4.64 3.71 Shota Imanaga CHC 7 41 171 .267 .306 16.4% 12.2% 4.17 3.83 3.71 Roki Sasaki LAD 7 31 2/3 145 .274 .278 5.5% 21.4% 6.25 6.33 5.33 Colin Rea CHC 7 32 1/3 146 .277 .313 9.6% 13.9% 5.29 5.71 4.48 Griffin Canning SDP 8 27 126 .284 .325 10.3% 16.7% 8.00 4.99 4.87 Aaron Nola PHI 7 35 155 .289 .327 15.5% 21.4% 6.69 4.65 3.86 Cristopher Sánchez PHI 7 42 1/3 187 .290 .368 20.9% 15.6% 3.19 3.75 2.71 Randy Vásquez SDP 7 27 130 .361 .333 0.8% 18.5% 8.00 11.97 6.39 Behind Miz, Buehler is the pitcher with the lowest batting average allowed and, even more strikingly, the lowest BABIP (.214) on the entire list. He has done it so far by leaving the opposition with the lowest line-drive rate (9.8%) in the group while still getting himself into trouble: he trails only Roki Sasaki (12.4 BB%) with a 12.3 BB% rate. Buehler has pitched at this level by solving many difficult situations, but also by getting himself into trouble because of his lack of command. Even so, he has not shied away from the toughest moments, holding the opposition to a .214/.267/.429 line in high-leverage situations. In 18 of his 27 starts, Buehler has completed at least five innings. In 21 instances, he has allowed three or fewer runs. He has been a more reliable arm than his peripheral numbers show. And, most importantly of all, he continues to show that he can compete under pressure. At this point in the season, that ability is what the Padres need most if they want to compete in October. View full article
-
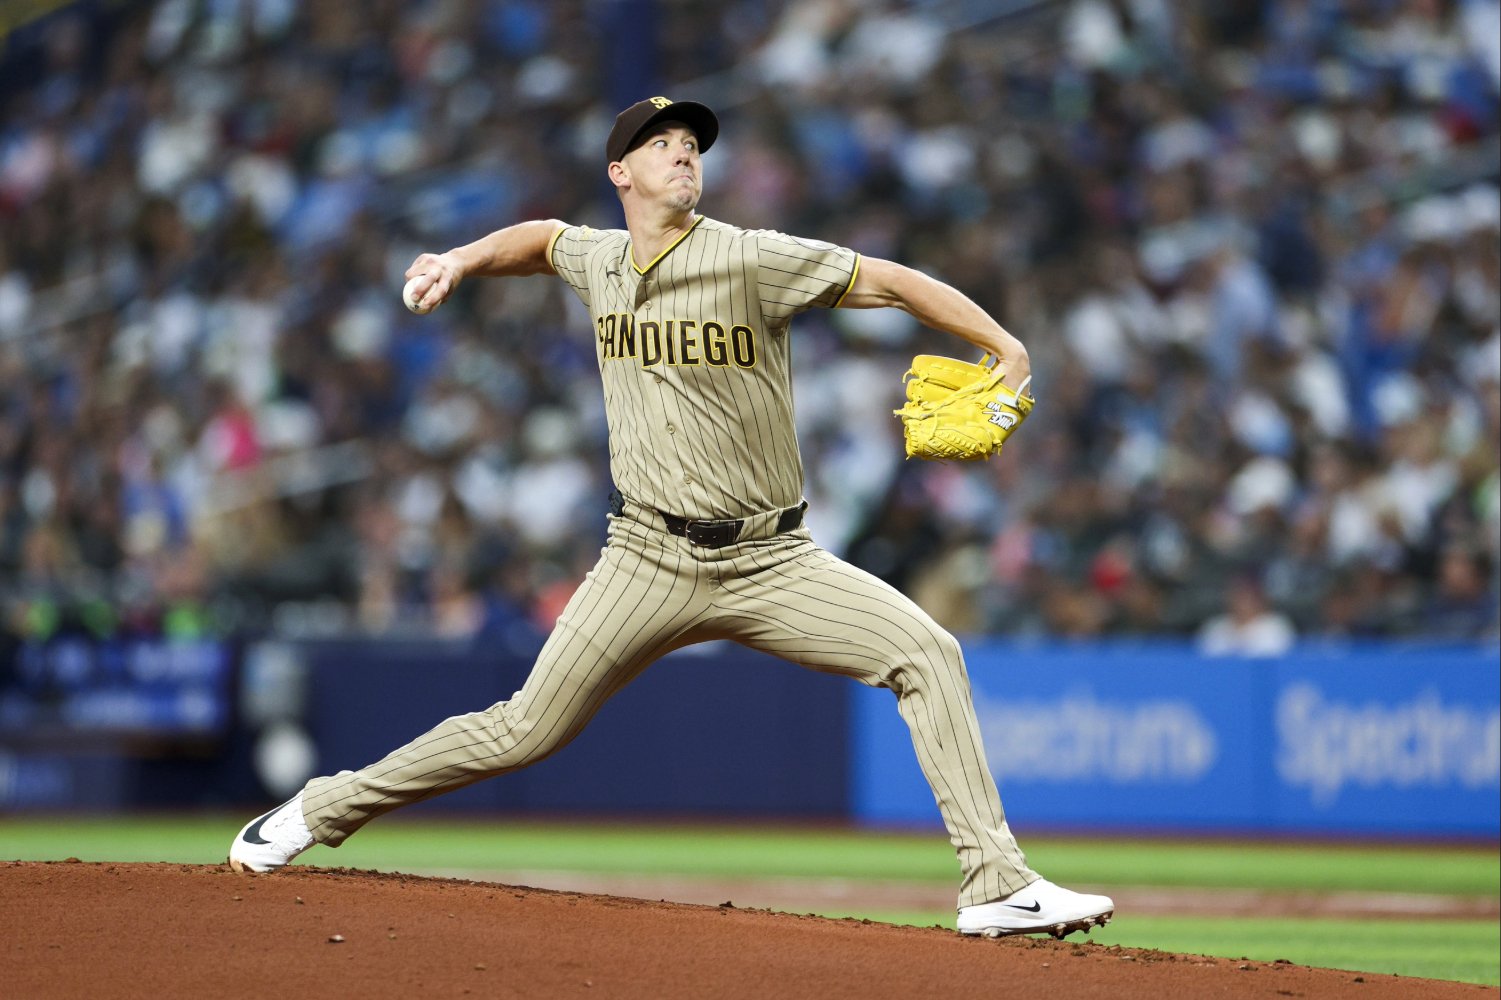 If we stop only at Walker Buehler’s 4.66 ERA, it would be enough to worry us down the stretch, with the San Diego Padres fighting for a Wild Card spot. I don’t like to blame ERA, though, since no statistic can tell the entire story of a pitcher in a single number. Buehler’s case is very interesting. Despite his high ERA, the Padres are 18-9 in games he has started. If we take away his three worst consecutive starts of the entire season, when he allowed 20 runs in 11 innings between July 1 and July 11, his ERA drops to 3.59. At that point, it gets pretty close to the 3.19 ERA he has posted over 42 ⅓ innings in his last eight starts. His inconsistencies in July reflected the problems that have followed the right-hander: his inability to stay ahead in the count and the problems that have affected his fastball and changeup. As the season has progressed, his strategy has changed. In April, the slider was his main weapon under pressure in decisive counts. Then, the sweeper took that place. In June, he switched to the cutter. In July, he went back to the slider after allowing three home runs and a .758 xSLG with the changeup. In August, his knuckle curve took control, while the sinker returned to dominating. In August, hitters posted a 32.7 O-Swing% against Buehler, his highest rate in any month this season. The overall results were encouraging, as he allowed the second-lowest wOBA (.308) of the entire year—only behind the .305 he allowed in June. But nothing summarizes Buehler’s season as a starter this year better than his performances when the pressure is highest. That was one of his best characteristics as a Dodgers pitcher, and it still seems that he can get an extra gear in the biggest moments. I extended the research I started when I wrote about Michael King’s improvements last week, and Buehler’s results really surprised me. I chose only the games involving teams that, if the regular season ended today, would have secured a direct postseason or Wild Card spot in the National League. They would be: the Milwaukee Brewers, Los Angeles Dodgers, Atlanta Braves, Chicago Cubs, Philadelphia Phillies and San Diego Padres. I chose all the games between them and filtered for pitchers who have faced at least 120 batters. There are 16 pitchers who meet that criterion. Take a look at the xFIP leaders: Jacob Misiorowski (MIL), 2.34 Chris Sale (ATL), 2.58 Yoshinobu Yamamoto (LAD), 2.64 Cristopher Sánchez (PHI), 2.71 Kyle Harrison (MIL), 3.44 Michael King (SDP), 3.71 Shota Imanaga (CHC), 3.71 Bryce Elder (ATL), 3.71 Most of the Game 1 postseason starters are in that top eight. There are other pitchers like Zack Wheeler (3.45) and Shane Drohan (3.19) who have been dominant, but they did not qualify because they have not faced enough batters. Now comes the point that will probably surprise you. Among so many top-level pitchers, Buehler also has a place when it comes to pitching under pressure. Name Tm G IP TBF AVG BABIP K-BB% HR/FB ERA xERA xFIP Jacob Misiorowski MIL 7 46 168 .151 .235 30.4% 2.6% 0.78 1.67 2.34 Walker Buehler SDP 7 37 155 .188 .214 7.7% 9.1% 4.38 4.03 4.98 Yoshinobu Yamamoto LAD 7 44 2/3 171 .192 .265 23.4% 10.7% 1.21 2.81 2.64 Chris Sale ATL 8 52 2/3 207 .201 .291 28.5% 4.3% 1.37 2.45 2.58 Michael King SDP 6 36 148 .206 .281 14.9% 0.0% 2.00 3.47 3.71 Justin Wrobleski LAD 7 43 1/3 180 .220 .232 17.2% 17.9% 5.19 4.40 4.08 Kyle Harrison MIL 7 37 2/3 157 .248 .281 22.9% 20.0% 3.82 3.15 3.44 Emmet Sheehan LAD 6 29 2/3 126 .250 .311 20.6% 13.5% 4.25 3.47 3.82 Bryce Elder ATL 5 30 2/3 131 .262 .309 13.0% 10.7% 4.70 4.64 3.71 Shota Imanaga CHC 7 41 171 .267 .306 16.4% 12.2% 4.17 3.83 3.71 Roki Sasaki LAD 7 31 2/3 145 .274 .278 5.5% 21.4% 6.25 6.33 5.33 Colin Rea CHC 7 32 1/3 146 .277 .313 9.6% 13.9% 5.29 5.71 4.48 Griffin Canning SDP 8 27 126 .284 .325 10.3% 16.7% 8.00 4.99 4.87 Aaron Nola PHI 7 35 155 .289 .327 15.5% 21.4% 6.69 4.65 3.86 Cristopher Sánchez PHI 7 42 1/3 187 .290 .368 20.9% 15.6% 3.19 3.75 2.71 Randy Vásquez SDP 7 27 130 .361 .333 0.8% 18.5% 8.00 11.97 6.39 Behind Miz, Buehler is the pitcher with the lowest batting average allowed and, even more strikingly, the lowest BABIP (.214) on the entire list. He has done it so far by leaving the opposition with the lowest line-drive rate (9.8%) in the group while still getting himself into trouble: he trails only Roki Sasaki (12.4 BB%) with a 12.3 BB% rate. Buehler has pitched at this level by solving many difficult situations, but also by getting himself into trouble because of his lack of command. Even so, he has not shied away from the toughest moments, holding the opposition to a .214/.267/.429 line in high-leverage situations. In 18 of his 27 starts, Buehler has completed at least five innings. In 21 instances, he has allowed three or fewer runs. He has been a more reliable arm than his peripheral numbers show. And, most importantly of all, he continues to show that he can compete under pressure. At this point in the season, that ability is what the Padres need most if they want to compete in October.
 -
In a certain way, it may seem that this version of Michael King is less dominant than before. His drop in strikeout rate to 7.79 K/9 this season suggests a greater risk when allowing contact. However, far from hurting King, his new approach to attacking the opposition has brought a good part of what the San Diego Padres will need if they reach the postseason: durability and efficiency. Barring an unexpected debacle, the Dodgers will dominate the National League West, so the option for the Padres will be to look for a spot to compete for the Wild Card. Reaching October with that challenge requires great ability and collective cohesion to face short series, where a bad start can be fatal. Above all during this second half of the season, the Padres have shown that they can play at a high level. The offense has been at its best, the defense is doing its job, and they have the best closer in the game leading one of the toughest bullpens to get through. The least consistent part of the equation has been the performances of the starting pitching corps. The Padres have used 14 starters who have made at least three starts. Through it all, King remains the main man in the rotation, with 27 starts and 2.1 fWAR. If his new profile, with less strikeout power, has raised doubts for you, you should hear this: hitters are producing against him the lowest BABIP (.252) and the lowest Pull-Air% rate (14.4%) of his career, and he is inducing his highest percentage of ground balls (45.2 GB%) since 2022. King’s main pitch remains the sinker, but he has replaced part of the presence of his fastball with greater use of the changeup (27.3%), the highest rate of his career. He has been more exposed to contact, but his performance shows that this version has also given the Padres consistency and durability. Those adjustments have not limited King’s ability to generate swings and misses, mind you. Quite the opposite. Although his strikeout rate has dropped from 9.33 K/9 to 7.79, his SwStr% rate remains intact at 10.4%. Instead, he is now providing more durability, with an average of 5⅔ innings per start. That level of depth and efficiency takes on even more value when we think about games under pressure during the postseason. For the Padres, even with the quality of their bullpen, King’s deep starts contrast with a collective problem in the rotation: San Diego ranks toward the bottom of the league in average innings from their starters, with just 4⅓ innings per start this season. Since July 3, King has recorded at least six innings in eight of his 10 starts, with a 2.72 ERA and 4.24 FIP in that span. The FIP remains relatively high, but the results have been there. He continues to be the number one starter in the rotation without question, and his competitiveness shows it. If we choose all the possible contenders for the Padres looking toward the postseason, look where King appears among the pitchers who have faced at least 120 opponents. For the ranking, I chose all the starts by starters against the Los Angeles Dodgers, the Milwaukee Brewers, the Philadelphia Phillies, the Atlanta Braves and the Chicago Cubs, since they represent the teams the Padres are most likely to run into in October. Name Tm G IP ERA xFIP HR/9 GB% TBF K/9 BB/9 K/BB Michael King SDP 6 36 2.00 3.72 0.00 48.4% 148 9.0 3.5 2.6 Logan Webb SFG 6 42 1.29 3.35 0.21 52.2% 156 6.9 1.7 4.0 Jacob Misiorowski MIL 6 39 0.92 2.53 0.23 45.2% 143 11.5 2.1 5.6 Matthew Liberatore STL 8 41 3.07 3.66 0.44 35.9% 169 10.3 3.3 3.1 Chris Sale ATL 6 37.2 1.19 2.63 0.48 45.8% 148 10.5 1.4 7.3 Eduardo Rodriguez ARI 8 47.2 2.08 4.19 0.76 38.0% 192 7.0 2.1 3.4 Cade Cavalli WSN 6 34.2 2.34 3.37 0.78 47.7% 139 9.9 2.3 4.2 Nolan McLean NYM 7 41 3.07 3.24 0.88 48.0% 164 10.5 3.3 3.2 Brandon Pfaadt ARI 6 36.2 2.95 4.39 0.98 44.6% 145 5.4 2.2 2.4 Foster Griffin WSN 8 46 2.54 4.20 1.37 44.8% 187 7.0 2.7 2.6 There are big names there. But against the big rivals the Padres could face in October, King has not allowed a single home run this season after challenging 148 opponents. His overall xFIP of 4.32 drops to 3.72 when he faces the best contenders in the National League. He has also allowed a high ground-ball rate and maintains an average of six innings per start in that group. The exposure to more contact remains a risk that King has taken with his adjustments this season, but he has been reliable in the big challenges. And that is the comparison that weighs the most here: how the frontline starters in the rotation have pitched against their possible contenders. No other Padres starting pitcher has come close to that level of dominance, which shows that King remains the number one starter in the rotation. Name Tm G IP TBF xFIP xERA Michael King SDP 6 36 148 3.72 3.46 JP Sears SDP 4 20.1 85 4.45 5.10 Walker Buehler SDP 7 37 155 4.99 4.02 Randy Vásquez SDP 5 23 105 6.43 11.55 Griffin Canning SDP 4 17.2 78 5.05 5.23 There is still not enough of a sample to evaluate Robbie Ray and Casey Mize, but as the end of the season approaches, we will have a better idea of how they have responded under pressure. Another detail that marks King’s consistency and has caught my attention is his effectiveness when he pitches with four days of rest. In those games, he has a 5-1 record and a 1.91 ERA. King leads all MLB starters in that situation with the lowest OPS+ (52) allowed, leaving behind Dylan Cease (54) of the Blue Jays, an American League Cy Young contender. In six of those 10 starts this year, he has left his opponents at one run or none; he has two starts allowing one hit and on only one occasion did they score three runs against him. On the other hand, when he rests one or two more days, he has a losing record of 3-7 and his ERA shoots up to 4.44 in 13 starts. Obviously, the Padres have had to distribute his workload, but the fact that King has been responding better with normal rest is another of the big pieces of good news looking toward the playoffs. View full article
-
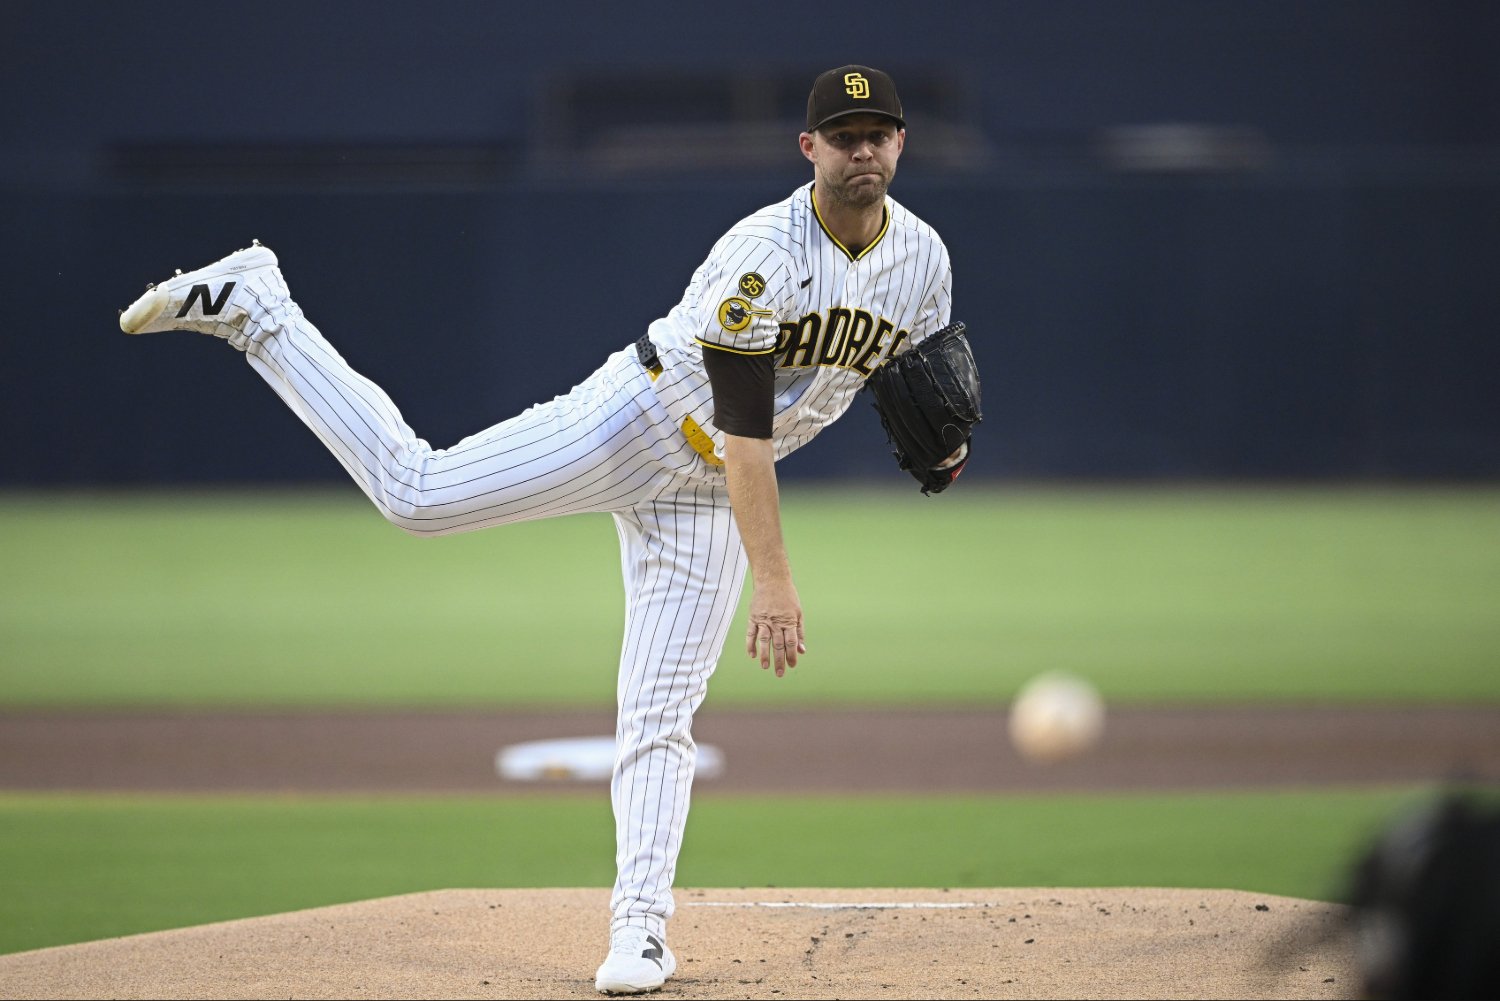 In a certain way, it may seem that this version of Michael King is less dominant than before. His drop in strikeout rate to 7.79 K/9 this season suggests a greater risk when allowing contact. However, far from hurting King, his new approach to attacking the opposition has brought a good part of what the San Diego Padres will need if they reach the postseason: durability and efficiency. Barring an unexpected debacle, the Dodgers will dominate the National League West, so the option for the Padres will be to look for a spot to compete for the Wild Card. Reaching October with that challenge requires great ability and collective cohesion to face short series, where a bad start can be fatal. Above all during this second half of the season, the Padres have shown that they can play at a high level. The offense has been at its best, the defense is doing its job, and they have the best closer in the game leading one of the toughest bullpens to get through. The least consistent part of the equation has been the performances of the starting pitching corps. The Padres have used 14 starters who have made at least three starts. Through it all, King remains the main man in the rotation, with 27 starts and 2.1 fWAR. If his new profile, with less strikeout power, has raised doubts for you, you should hear this: hitters are producing against him the lowest BABIP (.252) and the lowest Pull-Air% rate (14.4%) of his career, and he is inducing his highest percentage of ground balls (45.2 GB%) since 2022. King’s main pitch remains the sinker, but he has replaced part of the presence of his fastball with greater use of the changeup (27.3%), the highest rate of his career. He has been more exposed to contact, but his performance shows that this version has also given the Padres consistency and durability. Those adjustments have not limited King’s ability to generate swings and misses, mind you. Quite the opposite. Although his strikeout rate has dropped from 9.33 K/9 to 7.79, his SwStr% rate remains intact at 10.4%. Instead, he is now providing more durability, with an average of 5⅔ innings per start. That level of depth and efficiency takes on even more value when we think about games under pressure during the postseason. For the Padres, even with the quality of their bullpen, King’s deep starts contrast with a collective problem in the rotation: San Diego ranks toward the bottom of the league in average innings from their starters, with just 4⅓ innings per start this season. Since July 3, King has recorded at least six innings in eight of his 10 starts, with a 2.72 ERA and 4.24 FIP in that span. The FIP remains relatively high, but the results have been there. He continues to be the number one starter in the rotation without question, and his competitiveness shows it. If we choose all the possible contenders for the Padres looking toward the postseason, look where King appears among the pitchers who have faced at least 120 opponents. For the ranking, I chose all the starts by starters against the Los Angeles Dodgers, the Milwaukee Brewers, the Philadelphia Phillies, the Atlanta Braves and the Chicago Cubs, since they represent the teams the Padres are most likely to run into in October. Name Tm G IP ERA xFIP HR/9 GB% TBF K/9 BB/9 K/BB Michael King SDP 6 36 2.00 3.72 0.00 48.4% 148 9.0 3.5 2.6 Logan Webb SFG 6 42 1.29 3.35 0.21 52.2% 156 6.9 1.7 4.0 Jacob Misiorowski MIL 6 39 0.92 2.53 0.23 45.2% 143 11.5 2.1 5.6 Matthew Liberatore STL 8 41 3.07 3.66 0.44 35.9% 169 10.3 3.3 3.1 Chris Sale ATL 6 37.2 1.19 2.63 0.48 45.8% 148 10.5 1.4 7.3 Eduardo Rodriguez ARI 8 47.2 2.08 4.19 0.76 38.0% 192 7.0 2.1 3.4 Cade Cavalli WSN 6 34.2 2.34 3.37 0.78 47.7% 139 9.9 2.3 4.2 Nolan McLean NYM 7 41 3.07 3.24 0.88 48.0% 164 10.5 3.3 3.2 Brandon Pfaadt ARI 6 36.2 2.95 4.39 0.98 44.6% 145 5.4 2.2 2.4 Foster Griffin WSN 8 46 2.54 4.20 1.37 44.8% 187 7.0 2.7 2.6 There are big names there. But against the big rivals the Padres could face in October, King has not allowed a single home run this season after challenging 148 opponents. His overall xFIP of 4.32 drops to 3.72 when he faces the best contenders in the National League. He has also allowed a high ground-ball rate and maintains an average of six innings per start in that group. The exposure to more contact remains a risk that King has taken with his adjustments this season, but he has been reliable in the big challenges. And that is the comparison that weighs the most here: how the frontline starters in the rotation have pitched against their possible contenders. No other Padres starting pitcher has come close to that level of dominance, which shows that King remains the number one starter in the rotation. Name Tm G IP TBF xFIP xERA Michael King SDP 6 36 148 3.72 3.46 JP Sears SDP 4 20.1 85 4.45 5.10 Walker Buehler SDP 7 37 155 4.99 4.02 Randy Vásquez SDP 5 23 105 6.43 11.55 Griffin Canning SDP 4 17.2 78 5.05 5.23 There is still not enough of a sample to evaluate Robbie Ray and Casey Mize, but as the end of the season approaches, we will have a better idea of how they have responded under pressure. Another detail that marks King’s consistency and has caught my attention is his effectiveness when he pitches with four days of rest. In those games, he has a 5-1 record and a 1.91 ERA. King leads all MLB starters in that situation with the lowest OPS+ (52) allowed, leaving behind Dylan Cease (54) of the Blue Jays, an American League Cy Young contender. In six of those 10 starts this year, he has left his opponents at one run or none; he has two starts allowing one hit and on only one occasion did they score three runs against him. On the other hand, when he rests one or two more days, he has a losing record of 3-7 and his ERA shoots up to 4.44 in 13 starts. Obviously, the Padres have had to distribute his workload, but the fact that King has been responding better with normal rest is another of the big pieces of good news looking toward the playoffs.
 -
Before this season, Casey Mize’s slider had never been his most reliable pitch. After allowing a .529 slugging percentage in 2024, he tried to get it back in 2025. The adjustments led to an interesting improvement in his Vertical Break from 0.2 to 4.5 inches. This season, Mize began giving his slider more presence in key situations. He increased its usage by 11.0 percentage points, and kept the opposition under control while his fastball and split-finger continued to function as his most dominant pitches. However, the story began to take a turn after June and, after arriving in San Diego, the slider has become a problem for Mize and the Padres. Month O-Swing% Z-Swing% O-Contact% Z-Contact% SwStr% Mar/Apr 25.0% 50.7% 55.6% 76.3% 11.7% May 32.3% 51.5% 30.0% 76.5% 17.2% Jun 23.1% 50.0% 50.0% 89.5% 7.8% Jul 18.6% 78.1% 37.5% 88.0% 10.3% Aug 13.6% 40.8% 66.7% 85.0% 5.4% Aug vs Jul -5.0% -37.3% 29.2% -3.0% -4.9% Aug vs Jun -9.5% -9.2% 16.7% -4.5% -2.4% The most concerning points here lies in opposing hitters’ ability to connect with pitches outside the strike zone. They are not doing it with more swings. Since June, O-Swing% has fallen by 9.5%, but hitters have posted a 16.7% increase in O-Contact%. Mize has increased his slider usage by 7.0% since joining the Padres’ rotation in August, and opponents have raised their O-Contact% rate to 66.7%, the highest in any month this season. Mize has also stopped generating swings and misses. His SwStr% rate peaked at 11.7% and 17.2% between March/April and May. Over the last two months, it has fallen from 10.3% in July to 5.4% this month. There is one key point that may be at the root of the situation: the Vertical Drop on Mize’s slider has declined from 36.8 inches in his dominant 2024 season to 30.3 this year. Left-handed hitters, in particular, have taken advantage of Mize’s command lapses to produce better at-bats against his slider. Split PA K% BB% xBA xOBP xSLG BABIP Whiff% Hard Hit% Ideal Attack Angle % vs LHB Mar/Apr-Jun 32 21.9% 6.3% .181 .238 .361 .136 25.0% 47.8% 43.8% vs LHB Jul-Aug 22 4.5% 9.1% .344 .410 .516 .368 5.7% 47.4% 58.8% Differences — -17.4% 2.8% .163 .172 .155 .232 -19.3% -0.4% 15.0% As expected, Mize has stopped trusting his slider, limiting its usage with two strikes this month to 17.9% compared to the pitch distribution in July. That answers part of the reasons why we have seen his K% fall by 17.4%. That said, the danger has been present when left-handed hitters have put the ball in play over the last two months. To begin with, look at the 15.0% increase in Ideal Attack Angle. That says a lot about how well hitters are reading his pitches when attacking the slider. Then, the result of the expected metrics tells us the rest of the story: left-handed hitters have adjusted in such a way that they have raised their BABIP by .232 points, while cutting their swing-and-miss rate by a significant margin. There are almost no differences in HardHit%, but even without increasing the quality of contact, the production has been much higher across all expected metrics. Here we have the xSLG averages on the left during the initial stretch between March/April and June against left-handed hitters. Then, the rest of the season. Hitters are crushing the slider from the middle of the zone toward the lower outside corner. They have also gotten devastating contact in the lower inside part of the zone. Mize’s slider has only had a little life when it stays in the upper part of the zone or moves away. During the first months of the season, that was also where the most dominant trend was marked. Mize will have to choose a new plan to sustain his repertoire. He has the weapons, but his slider is definitely not at the level it needs to be to prove that the Padres’ bet on strengthening their rotation at the trade deadline was the right one. View full article
-
Casey Mize's Slider Has Become A Problem Padres Can't Ignore
Yirsandy Rodríguez posted an article in Padres
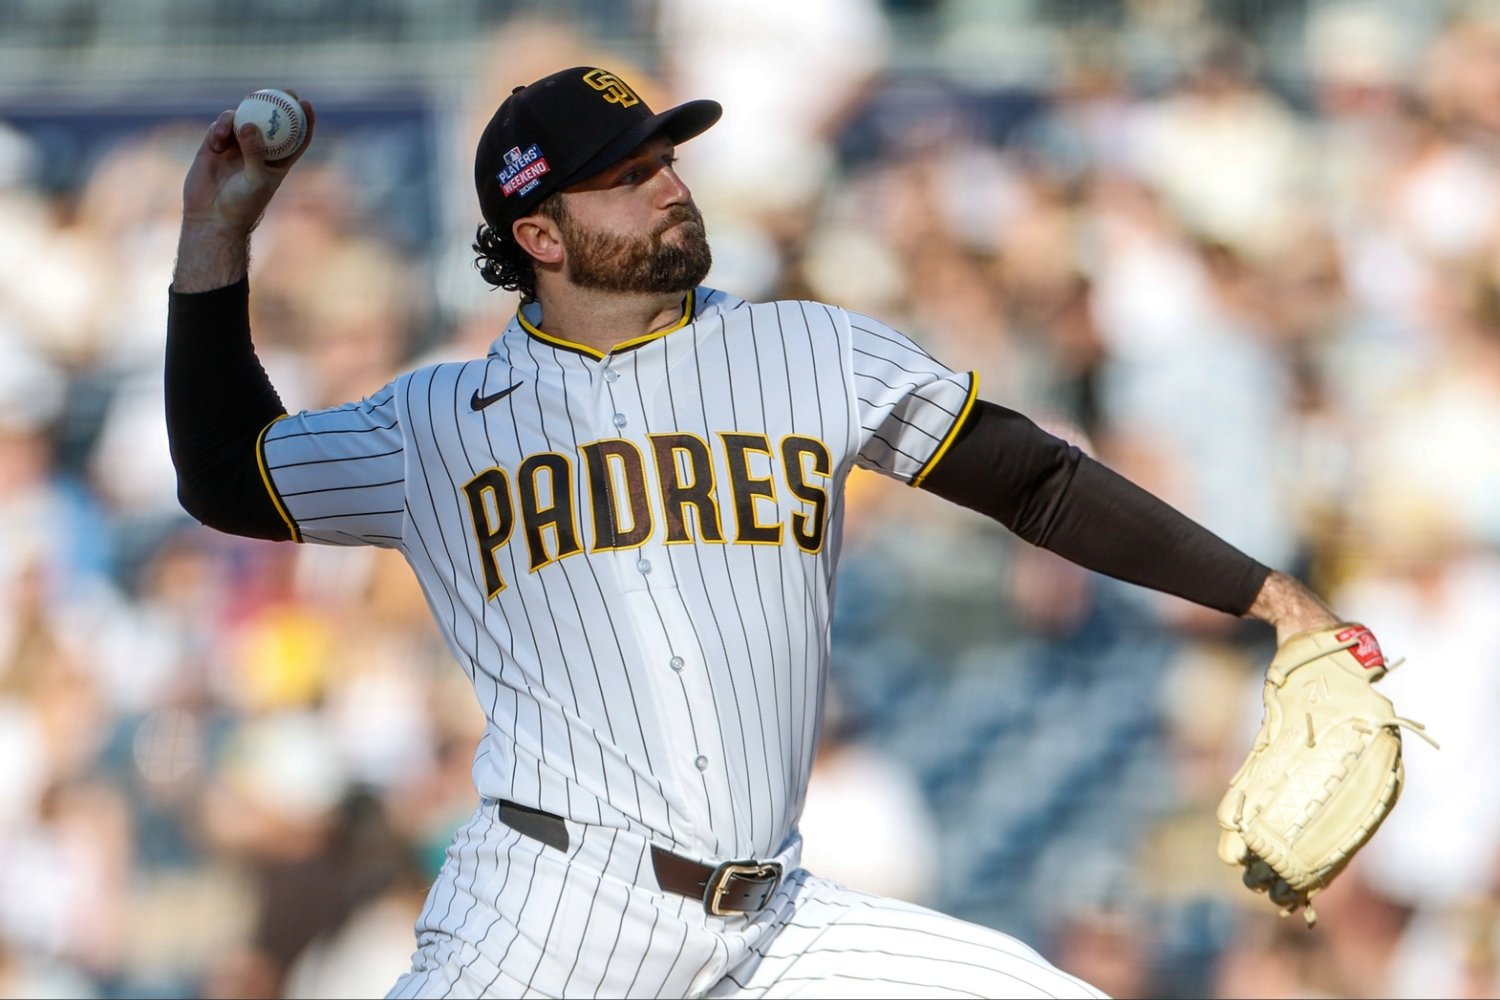 Before this season, Casey Mize’s slider had never been his most reliable pitch. After allowing a .529 slugging percentage in 2024, he tried to get it back in 2025. The adjustments led to an interesting improvement in his Vertical Break from 0.2 to 4.5 inches. This season, Mize began giving his slider more presence in key situations. He increased its usage by 11.0 percentage points, and kept the opposition under control while his fastball and split-finger continued to function as his most dominant pitches. However, the story began to take a turn after June and, after arriving in San Diego, the slider has become a problem for Mize and the Padres. Month O-Swing% Z-Swing% O-Contact% Z-Contact% SwStr% Mar/Apr 25.0% 50.7% 55.6% 76.3% 11.7% May 32.3% 51.5% 30.0% 76.5% 17.2% Jun 23.1% 50.0% 50.0% 89.5% 7.8% Jul 18.6% 78.1% 37.5% 88.0% 10.3% Aug 13.6% 40.8% 66.7% 85.0% 5.4% Aug vs Jul -5.0% -37.3% 29.2% -3.0% -4.9% Aug vs Jun -9.5% -9.2% 16.7% -4.5% -2.4% The most concerning points here lies in opposing hitters’ ability to connect with pitches outside the strike zone. They are not doing it with more swings. Since June, O-Swing% has fallen by 9.5%, but hitters have posted a 16.7% increase in O-Contact%. Mize has increased his slider usage by 7.0% since joining the Padres’ rotation in August, and opponents have raised their O-Contact% rate to 66.7%, the highest in any month this season. Mize has also stopped generating swings and misses. His SwStr% rate peaked at 11.7% and 17.2% between March/April and May. Over the last two months, it has fallen from 10.3% in July to 5.4% this month. There is one key point that may be at the root of the situation: the Vertical Drop on Mize’s slider has declined from 36.8 inches in his dominant 2024 season to 30.3 this year. Left-handed hitters, in particular, have taken advantage of Mize’s command lapses to produce better at-bats against his slider. Split PA K% BB% xBA xOBP xSLG BABIP Whiff% Hard Hit% Ideal Attack Angle % vs LHB Mar/Apr-Jun 32 21.9% 6.3% .181 .238 .361 .136 25.0% 47.8% 43.8% vs LHB Jul-Aug 22 4.5% 9.1% .344 .410 .516 .368 5.7% 47.4% 58.8% Differences — -17.4% 2.8% .163 .172 .155 .232 -19.3% -0.4% 15.0% As expected, Mize has stopped trusting his slider, limiting its usage with two strikes this month to 17.9% compared to the pitch distribution in July. That answers part of the reasons why we have seen his K% fall by 17.4%. That said, the danger has been present when left-handed hitters have put the ball in play over the last two months. To begin with, look at the 15.0% increase in Ideal Attack Angle. That says a lot about how well hitters are reading his pitches when attacking the slider. Then, the result of the expected metrics tells us the rest of the story: left-handed hitters have adjusted in such a way that they have raised their BABIP by .232 points, while cutting their swing-and-miss rate by a significant margin. There are almost no differences in HardHit%, but even without increasing the quality of contact, the production has been much higher across all expected metrics. Here we have the xSLG averages on the left during the initial stretch between March/April and June against left-handed hitters. Then, the rest of the season. Hitters are crushing the slider from the middle of the zone toward the lower outside corner. They have also gotten devastating contact in the lower inside part of the zone. Mize’s slider has only had a little life when it stays in the upper part of the zone or moves away. During the first months of the season, that was also where the most dominant trend was marked. Mize will have to choose a new plan to sustain his repertoire. He has the weapons, but his slider is definitely not at the level it needs to be to prove that the Padres’ bet on strengthening their rotation at the trade deadline was the right one.
 -
With September approaching and Mason Miller having logged 56⅓ innings, less than 10 frames of his career high (65) including the playoffs, there are several questions facing the San Diego Padres. Should they manage Miller’s workload a little more carefully? Or is it worth taking the necessary risks to win games? Miller is second in the National League with 32 saves, a 0.896 ERA, a 0.87 FIP and 3.2 fWAR. His imposing fastball is averaging 101.4 mph, and he has an absurd strikeout rate of 16.31 batters per nine innings. Miller is also the reliever with the most games finished (47) in the National League, another indication of his heavy workload. If the Padres’ plan is to give him rest whenever possible, lightening his workload could keep the right-hander much more prepared to face October. However, it is inevitable to think about the risk the bullpen would face when he is unavailable. At a postgame press conference earlier this month after Bradgley Rodriguez handled a save opportunity, manager Craig Stammen said that “there is absolutely nothing wrong with Mason. This was simply a matter of rest.” He also praised Rodriguez’s ability: “He’s going to get some opportunities here when Mason can’t pitch. We also have other guys in the bullpen: Adrián [Morejon], Jeremiah [Estrada], Jason [Adam] and all of them are capable of pitching the ninth inning." The Padres’ bullpen depth has been decisive throughout the season. They have the second-most innings pitched (565) in the National League and lead all of MLB with 7.5 fWAR. Miller and Morejón (2.3) have been the main pillars, combining for 5.5, followed by Rodriguez with 1.3. If we add Wandy Peralta to the equation, this is the result of the heavy workload each of them has carried: -Miller: 56 ⅓ innings (65 in 2024); six games below last season’s career high. -Morejón: 72 innings (73 2/3 last year); 14 fewer games than last year. -Peralta: 64 innings (71 ⅔ last year); 16 fewer games. -Rodriguez: 58 innings (45 ⅓ between the minor leagues and the Padres); 14 more games. That summary leads us to think about a bigger problem, since this is not just about Miller’s workload. Morejón, Peralta and Rodriguez have also accumulated a large number of innings and appearances, so they are also very likely to receive some rest. From there, the big question is how much risk the Padres will take when Miller is unavailable. And not all the answers are in the bullpen. The pitching analysis should begin with the starters. Throughout the season, the team has leaned on the bullpen because of the inconsistency of its rotation. The Padres still have the third-worst average innings per start, at 4⅓ per game. At the same time, they have the third-highest percentage of starters (41%) who do not reach 80 pitches. In other words, literally, the bullpen has carried the bulk of the outs every day. My colleagues @Steve Drumwright and @Randy Holt have insisted on the Padres Mission podcast about the need for the Padres’ starters to be able to deliver deep outings. Since Aug. 3, when Casey Mize and Robbie Ray arrived following the trade deadline, San Diego starters have covered 110 innings over 21 games, good for about 5.2 per start. Although Mize and Ray have had their lumps with the Friars, there is already a slight improvement in the rotation’s durability. We also shouldn’t rule out the offense becoming a turning point; since the deadline, the Padres are fifth in team wRC+ (110). That said, I see no reason to think that Miller’s rest, along with that of some of the other top relievers, is going to cause chaos. Between the seventh and ninth innings, the Padres have allowed the lowest slugging percentage (.334) in the entire league, tied with the Milwaukee Brewers’ pitchers. The bullpen’s only vulnerable point has come when relievers face the opposing lineup for a second time, allowing a .319/.391/.566 offensive line, with the fourth-highest OPS+ (145) in the entire league. So, even with Miller receiving more rest and likely taking turns with Morejón and Rodriguez to close out games, the most concerning point I see here remains the starting pitching. If they can go deeper and the offense continues to produce in clutch situations, the Padres will remain a strong contender heading into October. View full article
-
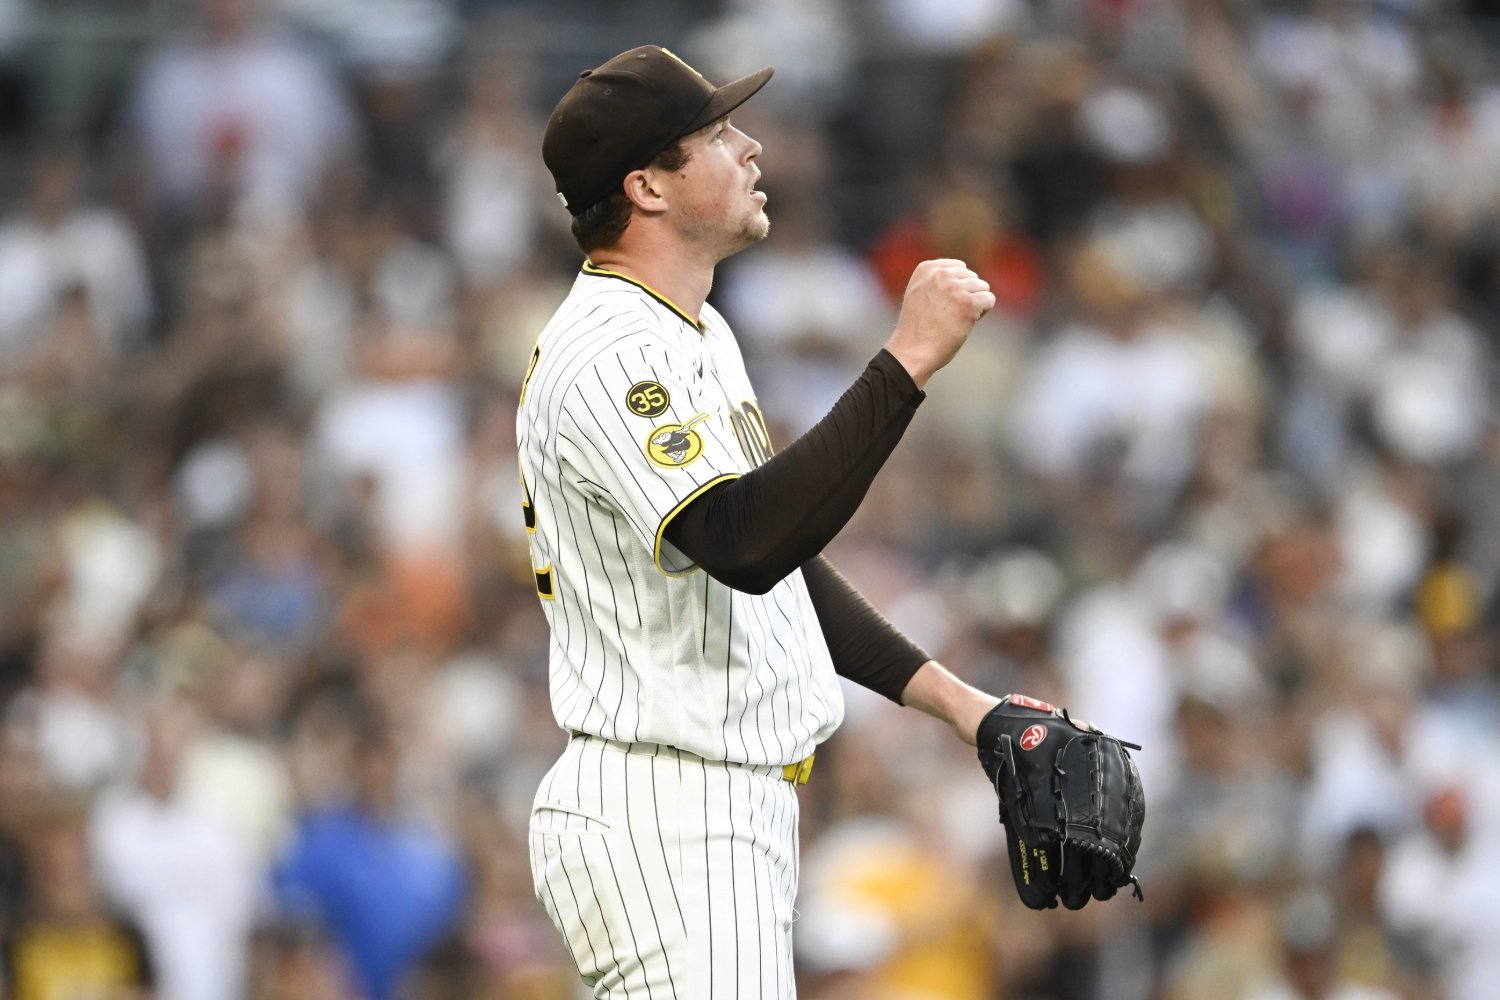 With September approaching and Mason Miller having logged 56⅓ innings, less than 10 frames of his career high (65) including the playoffs, there are several questions facing the San Diego Padres. Should they manage Miller’s workload a little more carefully? Or is it worth taking the necessary risks to win games? Miller is second in the National League with 32 saves, a 0.896 ERA, a 0.87 FIP and 3.2 fWAR. His imposing fastball is averaging 101.4 mph, and he has an absurd strikeout rate of 16.31 batters per nine innings. Miller is also the reliever with the most games finished (47) in the National League, another indication of his heavy workload. If the Padres’ plan is to give him rest whenever possible, lightening his workload could keep the right-hander much more prepared to face October. However, it is inevitable to think about the risk the bullpen would face when he is unavailable. At a postgame press conference earlier this month after Bradgley Rodriguez handled a save opportunity, manager Craig Stammen said that “there is absolutely nothing wrong with Mason. This was simply a matter of rest.” He also praised Rodriguez’s ability: “He’s going to get some opportunities here when Mason can’t pitch. We also have other guys in the bullpen: Adrián [Morejon], Jeremiah [Estrada], Jason [Adam] and all of them are capable of pitching the ninth inning." The Padres’ bullpen depth has been decisive throughout the season. They have the second-most innings pitched (565) in the National League and lead all of MLB with 7.5 fWAR. Miller and Morejón (2.3) have been the main pillars, combining for 5.5, followed by Rodriguez with 1.3. If we add Wandy Peralta to the equation, this is the result of the heavy workload each of them has carried: -Miller: 56 ⅓ innings (65 in 2024); six games below last season’s career high. -Morejón: 72 innings (73 2/3 last year); 14 fewer games than last year. -Peralta: 64 innings (71 ⅔ last year); 16 fewer games. -Rodriguez: 58 innings (45 ⅓ between the minor leagues and the Padres); 14 more games. That summary leads us to think about a bigger problem, since this is not just about Miller’s workload. Morejón, Peralta and Rodriguez have also accumulated a large number of innings and appearances, so they are also very likely to receive some rest. From there, the big question is how much risk the Padres will take when Miller is unavailable. And not all the answers are in the bullpen. The pitching analysis should begin with the starters. Throughout the season, the team has leaned on the bullpen because of the inconsistency of its rotation. The Padres still have the third-worst average innings per start, at 4⅓ per game. At the same time, they have the third-highest percentage of starters (41%) who do not reach 80 pitches. In other words, literally, the bullpen has carried the bulk of the outs every day. My colleagues @Steve Drumwright and @Randy Holt have insisted on the Padres Mission podcast about the need for the Padres’ starters to be able to deliver deep outings. Since Aug. 3, when Casey Mize and Robbie Ray arrived following the trade deadline, San Diego starters have covered 110 innings over 21 games, good for about 5.2 per start. Although Mize and Ray have had their lumps with the Friars, there is already a slight improvement in the rotation’s durability. We also shouldn’t rule out the offense becoming a turning point; since the deadline, the Padres are fifth in team wRC+ (110). That said, I see no reason to think that Miller’s rest, along with that of some of the other top relievers, is going to cause chaos. Between the seventh and ninth innings, the Padres have allowed the lowest slugging percentage (.334) in the entire league, tied with the Milwaukee Brewers’ pitchers. The bullpen’s only vulnerable point has come when relievers face the opposing lineup for a second time, allowing a .319/.391/.566 offensive line, with the fourth-highest OPS+ (145) in the entire league. So, even with Miller receiving more rest and likely taking turns with Morejón and Rodriguez to close out games, the most concerning point I see here remains the starting pitching. If they can go deeper and the offense continues to produce in clutch situations, the Padres will remain a strong contender heading into October.
 -
In baseball, one of the biggest concerns for a left-handed hitter is almost always facing a pitcher with the same profile. It is never comfortable enough, and one of the reasons is that you simply do not see lefty-vs.-lefty matchups every day. San Diego Padres second baseman Jake Cronenworth would tell you the opposite about that approach. There is a major reason behind that conversation, and it is that Cronenworth is being neutralized by right-handed pitchers. His 75 wRC+ in 222 plate appearances is the ninth-lowest in the league among left-handed hitters with at least 200 PA against right-handed pitchers this year. But that is not the worst part. Any hitter can go through a slump and then show signs of recovery. Cronenworth’s problem is unprecedented. He is going through the worst stretch of his career, and the offensive collapse has been devastating. Listen to and internalize what this combination of inconsistencies at the plate means: he is producing the highest ground-ball percentage of his career (50.0), the lowest line-drive percentage (16.4), along with his highest strikeout rate (23.0 K%). His .215/.308/.287 slash line, .595 OPS and .072 ISO are also career lows. Yes, there is more. The problems have reached his plate-discipline metrics, with career-worst rates in SwStr% (9.1), Contact% (79.4), O-Contact% (54.1) and O-Swing% (27.3). The strangest part of all is that Cronenworth has never had major consistency problems that have been exposed against right-handed pitchers. In fact, he is coming off a couple of seasons in which he averaged a 120 wRC+, and he is still a hitter who has outperformed the league over his career in this split. So this creates a major contradiction. What has caused such an unexpected collapse in Cronenworth’s profile, and how can he solve it? To start, it is true that he is striking out like never before in his career, but he is only 2.5 percentage points above the league average. He is still walking (10.8 BB%) at a rate close to the average (10.0) and remains above that standard in HardHit% (35.9). So, we have to go a little deeper to discover where the real breakdown is in Cronenworth’s swing and how opponents are limiting him. As usual, this story starts with fastballs. Opponents are using them 66.9% of the time, the second-highest percentage of his career behind the 69.6% from 2024. In other words, the rest of the pitches, between a litany breaking balls and off-speed pitches, represent about one-third of what he's seeing. This is what happened when I separated both groups and mixed in some key metrics for power, plate discipline and swing evaluation. Group K% xSLG xwOBA BABIP Whiff% Hard Hit% Ideal Attack Angle % Fastballs 14.3 .412 .362 .284 13.2 44.3 28.5 Not Fastballs 37.8 .207 .180 .261 40.4 19.1 44.6 Difference -23.5 .205 .182 .023 -27.2 25.2 -16.1 *Note: The statistics include all pitch types that were recorded at least five times.* As expected, there are several interesting trends here. Within the chaos, Cronenworth has continued to take advantage of fastballs. Even with a 16.1-point drop in Ideal Attack Angle%, he has managed to produce a .284 BABIP. He is striking out 23.5 percentage points less, has eliminated a large amount of Whiffs%, while sustaining a similar increase in Hard Hit% and double the xSLG and xwOBA, respectively. In other words, when you analyze Cronenworth only against right-handed pitchers’ fastballs, the story does not look nearly as chaotic. Quite the opposite, in fact, as it appears when we look the other way: all the pitches that are not fastballs. You can clearly see that BABIP is the only point where Cronenworth’s contact ability still makes a difference. Here we have the graphical comparison of Cronenworth against right-handers’ fastballs (left) and the rest of the pitches from righties (right). Notice how blue dominates the whiff rates against fastballs. There are no misses in the lower portions of the middle to the outer part. The biggest problems appear in the upper-third outside the strike zone and down and in. Those are pitches Cronenworth could stop chasing if he improves his plate discipline. Even so, check the expected averages on the right. His swing can still handle the fastball in the strike zone, and he can crush pitches on the inner part of the plate. Everything would be very different within this slump if he only had to face fastballs. But the game is much more challenging, and pitchers know where to look for weaknesses. And, you know, it all starts with a choice. Cronenworth is chasing too many pitches outside the strike zone. Unlike fastballs, he does not have problems when the rest of the offerings hang up high in the strike zone. His best xBA marks remain in similar areas where he has also punished fastballs. But there is a point here that I find even more revealing and that could be a key piece of this puzzle: Cronenworth is averaging 44.6% in Ideal Attack Angle. That is 16.1 percentage points higher than his swing against fastballs. But here is a difference we cannot overlook: the exit velocity on his batted balls is lower, at just 84.3 mph. If you're not hitting the ball hard... well, it doesn't really matter at what angle you strike it, does it? This is going to require a multitude of changes to fix, which means that this problem likely can't be solved during the middle of a playoff push. Cronenworth hasn't completely lost his way at the plate, but as right-handed pitchers continue to expose his weakness against the soft stuff, he's going to have to feast on the steady diet of fastballs he's receiving to salvage his season. View full article
-
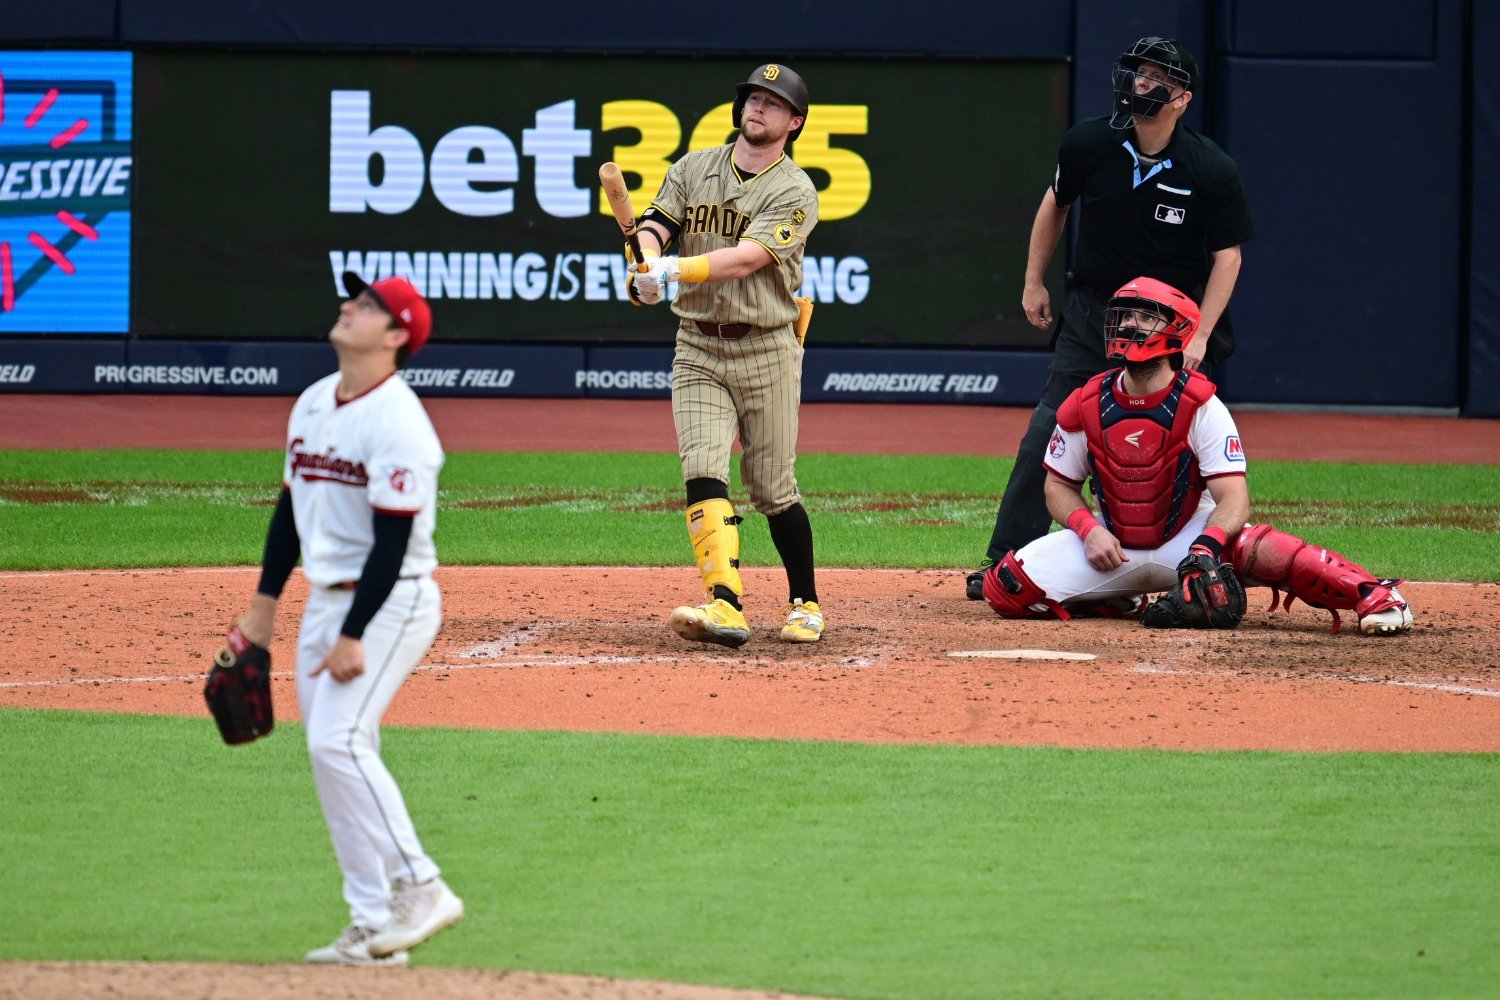 In baseball, one of the biggest concerns for a left-handed hitter is almost always facing a pitcher with the same profile. It is never comfortable enough, and one of the reasons is that you simply do not see lefty-vs.-lefty matchups every day. San Diego Padres second baseman Jake Cronenworth would tell you the opposite about that approach. There is a major reason behind that conversation, and it is that Cronenworth is being neutralized by right-handed pitchers. His 75 wRC+ in 222 plate appearances is the ninth-lowest in the league among left-handed hitters with at least 200 PA against right-handed pitchers this year. But that is not the worst part. Any hitter can go through a slump and then show signs of recovery. Cronenworth’s problem is unprecedented. He is going through the worst stretch of his career, and the offensive collapse has been devastating. Listen to and internalize what this combination of inconsistencies at the plate means: he is producing the highest ground-ball percentage of his career (50.0), the lowest line-drive percentage (16.4), along with his highest strikeout rate (23.0 K%). His .215/.308/.287 slash line, .595 OPS and .072 ISO are also career lows. Yes, there is more. The problems have reached his plate-discipline metrics, with career-worst rates in SwStr% (9.1), Contact% (79.4), O-Contact% (54.1) and O-Swing% (27.3). The strangest part of all is that Cronenworth has never had major consistency problems that have been exposed against right-handed pitchers. In fact, he is coming off a couple of seasons in which he averaged a 120 wRC+, and he is still a hitter who has outperformed the league over his career in this split. So this creates a major contradiction. What has caused such an unexpected collapse in Cronenworth’s profile, and how can he solve it? To start, it is true that he is striking out like never before in his career, but he is only 2.5 percentage points above the league average. He is still walking (10.8 BB%) at a rate close to the average (10.0) and remains above that standard in HardHit% (35.9). So, we have to go a little deeper to discover where the real breakdown is in Cronenworth’s swing and how opponents are limiting him. As usual, this story starts with fastballs. Opponents are using them 66.9% of the time, the second-highest percentage of his career behind the 69.6% from 2024. In other words, the rest of the pitches, between a litany breaking balls and off-speed pitches, represent about one-third of what he's seeing. This is what happened when I separated both groups and mixed in some key metrics for power, plate discipline and swing evaluation. Group K% xSLG xwOBA BABIP Whiff% Hard Hit% Ideal Attack Angle % Fastballs 14.3 .412 .362 .284 13.2 44.3 28.5 Not Fastballs 37.8 .207 .180 .261 40.4 19.1 44.6 Difference -23.5 .205 .182 .023 -27.2 25.2 -16.1 *Note: The statistics include all pitch types that were recorded at least five times.* As expected, there are several interesting trends here. Within the chaos, Cronenworth has continued to take advantage of fastballs. Even with a 16.1-point drop in Ideal Attack Angle%, he has managed to produce a .284 BABIP. He is striking out 23.5 percentage points less, has eliminated a large amount of Whiffs%, while sustaining a similar increase in Hard Hit% and double the xSLG and xwOBA, respectively. In other words, when you analyze Cronenworth only against right-handed pitchers’ fastballs, the story does not look nearly as chaotic. Quite the opposite, in fact, as it appears when we look the other way: all the pitches that are not fastballs. You can clearly see that BABIP is the only point where Cronenworth’s contact ability still makes a difference. Here we have the graphical comparison of Cronenworth against right-handers’ fastballs (left) and the rest of the pitches from righties (right). Notice how blue dominates the whiff rates against fastballs. There are no misses in the lower portions of the middle to the outer part. The biggest problems appear in the upper-third outside the strike zone and down and in. Those are pitches Cronenworth could stop chasing if he improves his plate discipline. Even so, check the expected averages on the right. His swing can still handle the fastball in the strike zone, and he can crush pitches on the inner part of the plate. Everything would be very different within this slump if he only had to face fastballs. But the game is much more challenging, and pitchers know where to look for weaknesses. And, you know, it all starts with a choice. Cronenworth is chasing too many pitches outside the strike zone. Unlike fastballs, he does not have problems when the rest of the offerings hang up high in the strike zone. His best xBA marks remain in similar areas where he has also punished fastballs. But there is a point here that I find even more revealing and that could be a key piece of this puzzle: Cronenworth is averaging 44.6% in Ideal Attack Angle. That is 16.1 percentage points higher than his swing against fastballs. But here is a difference we cannot overlook: the exit velocity on his batted balls is lower, at just 84.3 mph. If you're not hitting the ball hard... well, it doesn't really matter at what angle you strike it, does it? This is going to require a multitude of changes to fix, which means that this problem likely can't be solved during the middle of a playoff push. Cronenworth hasn't completely lost his way at the plate, but as right-handed pitchers continue to expose his weakness against the soft stuff, he's going to have to feast on the steady diet of fastballs he's receiving to salvage his season.
 -
Xander Bogaerts is having the worst offensive season of his career. At 33 years old, he is hitting .221/.316/.324 with an 85 wRC+ for the San Diego Padres. Those are the lowest outputs among his full seasons since he posted an 81 wRC+ and 0.1 fWAR in 2014, his first season as a starter with the Red Sox. However, there is a question that sounds more interesting than why he's got such a low average: How can a hitter maintain one of the best disciplines in the league and, at the same time, become a much less productive version of himself? When exploring Bogaerts’ profile, it is clear that the reason for his inconsistency is not his plate discipline. His O-Swing% of 23.1% ranks in the 89th percentile of MLB. His BB% increased from 8.2% in 2025 to 11.9% this year, and his swing rate has barely changed, from 41.9% to 41.7%. Bogaerts is still generating hard contact, but that contact is no longer producing the same value. His 39.8% Hard-Hit rate does not support the offensive decline, as that's his best mark since 2021 (43.0%). However, the expected averages bring us much closer to the root of the collapse. His .247 xBA and .374 xSLG this year are his worst marks since 2017, when he had also posted the lowest levels of his career up to that point. Once we break down those expected averages, we get to where we wanted to be. And, to answer your biggest question, no fastballs have not been the culprits stopping Bogaerts’ swing. His hands are still skilled at attacking velocity on time and producing quality at-bats. Against fastballs, he is averaging a .442 xSLG, the highest of his career since 2021. He has produced a .395 xwOBA, .518 xSLG and 46.3% Hard-Hit% against the four-seam. His Whiff% against fastballs is just 13.6%. The challenge he has not been able to solve appears when pitchers mix breaking pitches and off-speed pitches. During his last four years with the Red Sox, when Bogaerts built a profile that made him one of the most complete shortstops in MLB, you could still see the gap between his ability to destroy fastballs and the breakdowns that appeared against the rest of the pitches. When he arrived in San Diego in 2023, that profile improved significantly, but since then Bogaerts has not been able to sustain it. By comparing his performance across these three periods, we can see where the inconsistencies that have now reached a concerning point began to appear: Xander Bogaerts vs. Breaking & Off-speed Pitches PERIOD Pitch% PA BABIP xwOBA xBA xSLG Swing-miss% Barrel/BBE% 2019-2022 43.3 885 .318 .298 .229 .364 32.8 6.8 2023-2026 44.6 889 .302 .287 .233 .352 30.0 5.5 2026 45 181 .234 .251 .200 .275 34.2 3.5 As you already know, the period between 2019 and 2022 covers Bogaerts’ final four years in Boston. The next one covers his first four years in San Diego, and then we have 2026. The most concerning decline appears in everything related to offensive production, especially in xwOBA and xSLG, while BABIP has also fallen considerably. But expected stats aren't enough. So I made sure to go a little deeper. I explored how Bogaerts’ swing impacted every part of the strike zone, and it is evident that his production was much more complete during his final four seasons in Boston. xwOBA 2019-2022 vs. Breaking & Off-speed Pitches xwOBA 2023-2026 vs. Breaking & Off-speed Pitches In Boston, he had just one weak point inside the strike zone: a .241 xwOBA in the lower corner, curiously the same mark he has had during this stretch with the Padres. Most of the notable differences appear in what he stopped producing with his swing against pitches down in the zone. And that is where the 2026 chart changes the story. This year, Bogaerts has been able to produce above-average results in only one quadrant inside the strike zone and, surprisingly, it's when he reaches for pitches high outside of it. If you have followed Bogaerts for some time, you know that he loves to swing at the first pitch. This year, his 24.2% rate is the highest of his career in that situation, and he has gotten some good dividends from it, with a .909 OPS, his best mark since 2021. And yet, that efficiency has also not been able to appear against the mix of breaking pitches and off-speed pitches, where he has produced just a .209 xBA and .228 xSLG. Bogaerts still knows which pitch he wants to attack. The problem is that, increasingly, finding it no longer guarantees that he can do damage with it. As long as he's got flaws in his swing that are this exploitable, the Padres are going to have to find a way to navigate around a black hole in their lineup. View full article
-
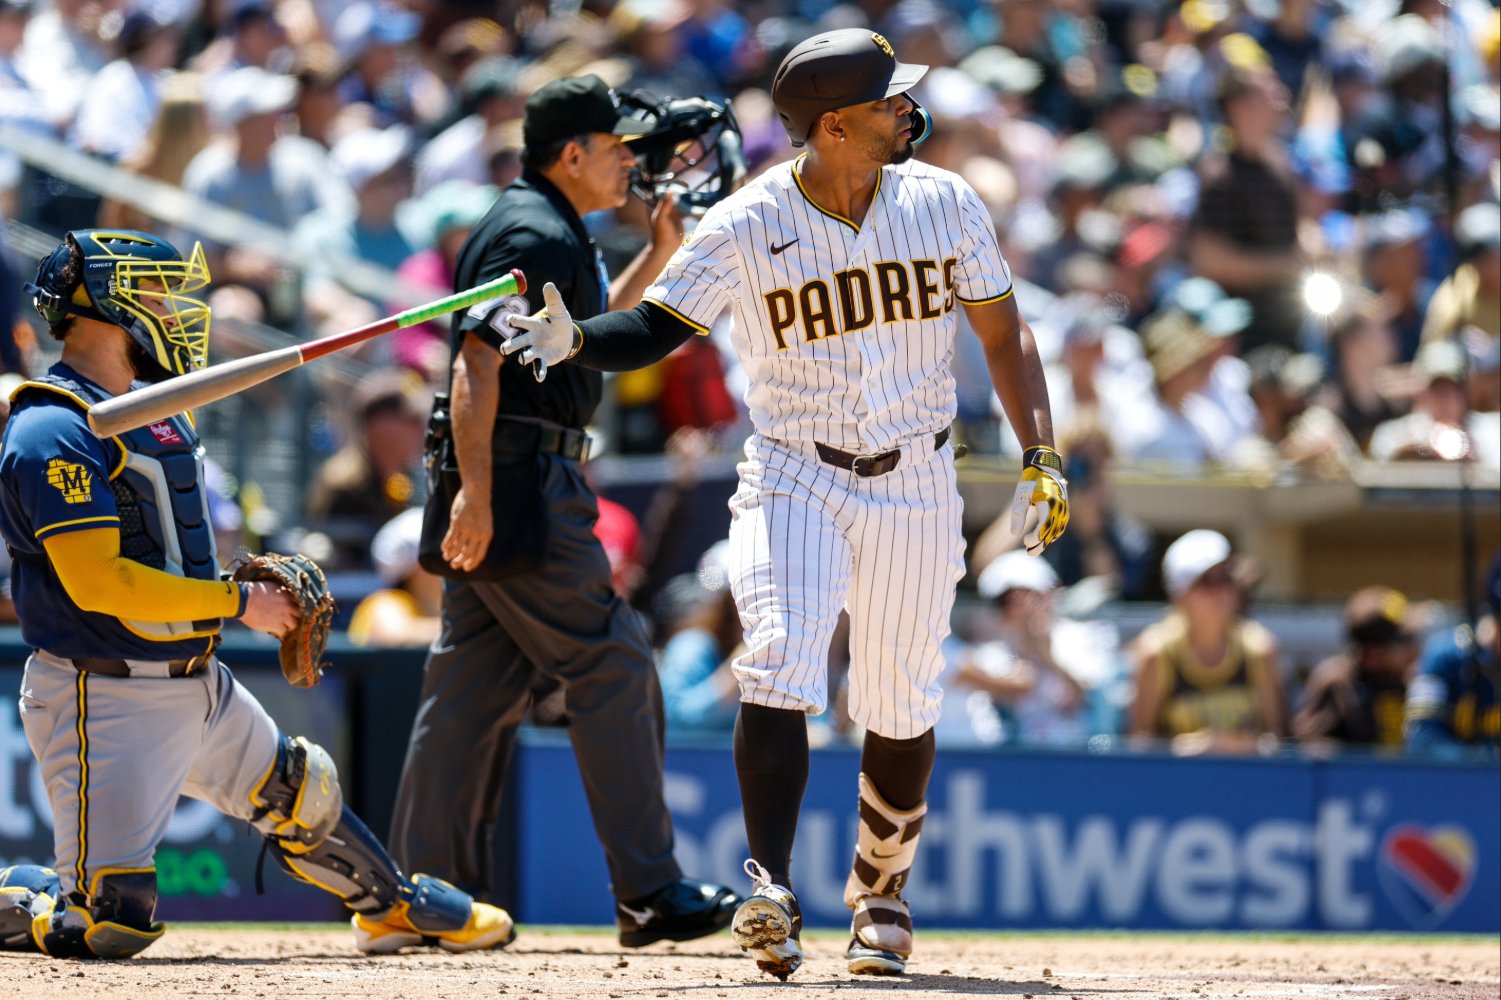 Xander Bogaerts is having the worst offensive season of his career. At 33 years old, he is hitting .221/.316/.324 with an 85 wRC+ for the San Diego Padres. Those are the lowest outputs among his full seasons since he posted an 81 wRC+ and 0.1 fWAR in 2014, his first season as a starter with the Red Sox. However, there is a question that sounds more interesting than why he's got such a low average: How can a hitter maintain one of the best disciplines in the league and, at the same time, become a much less productive version of himself? When exploring Bogaerts’ profile, it is clear that the reason for his inconsistency is not his plate discipline. His O-Swing% of 23.1% ranks in the 89th percentile of MLB. His BB% increased from 8.2% in 2025 to 11.9% this year, and his swing rate has barely changed, from 41.9% to 41.7%. Bogaerts is still generating hard contact, but that contact is no longer producing the same value. His 39.8% Hard-Hit rate does not support the offensive decline, as that's his best mark since 2021 (43.0%). However, the expected averages bring us much closer to the root of the collapse. His .247 xBA and .374 xSLG this year are his worst marks since 2017, when he had also posted the lowest levels of his career up to that point. Once we break down those expected averages, we get to where we wanted to be. And, to answer your biggest question, no fastballs have not been the culprits stopping Bogaerts’ swing. His hands are still skilled at attacking velocity on time and producing quality at-bats. Against fastballs, he is averaging a .442 xSLG, the highest of his career since 2021. He has produced a .395 xwOBA, .518 xSLG and 46.3% Hard-Hit% against the four-seam. His Whiff% against fastballs is just 13.6%. The challenge he has not been able to solve appears when pitchers mix breaking pitches and off-speed pitches. During his last four years with the Red Sox, when Bogaerts built a profile that made him one of the most complete shortstops in MLB, you could still see the gap between his ability to destroy fastballs and the breakdowns that appeared against the rest of the pitches. When he arrived in San Diego in 2023, that profile improved significantly, but since then Bogaerts has not been able to sustain it. By comparing his performance across these three periods, we can see where the inconsistencies that have now reached a concerning point began to appear: Xander Bogaerts vs. Breaking & Off-speed Pitches PERIOD Pitch% PA BABIP xwOBA xBA xSLG Swing-miss% Barrel/BBE% 2019-2022 43.3 885 .318 .298 .229 .364 32.8 6.8 2023-2026 44.6 889 .302 .287 .233 .352 30.0 5.5 2026 45 181 .234 .251 .200 .275 34.2 3.5 As you already know, the period between 2019 and 2022 covers Bogaerts’ final four years in Boston. The next one covers his first four years in San Diego, and then we have 2026. The most concerning decline appears in everything related to offensive production, especially in xwOBA and xSLG, while BABIP has also fallen considerably. But expected stats aren't enough. So I made sure to go a little deeper. I explored how Bogaerts’ swing impacted every part of the strike zone, and it is evident that his production was much more complete during his final four seasons in Boston. xwOBA 2019-2022 vs. Breaking & Off-speed Pitches xwOBA 2023-2026 vs. Breaking & Off-speed Pitches In Boston, he had just one weak point inside the strike zone: a .241 xwOBA in the lower corner, curiously the same mark he has had during this stretch with the Padres. Most of the notable differences appear in what he stopped producing with his swing against pitches down in the zone. And that is where the 2026 chart changes the story. This year, Bogaerts has been able to produce above-average results in only one quadrant inside the strike zone and, surprisingly, it's when he reaches for pitches high outside of it. If you have followed Bogaerts for some time, you know that he loves to swing at the first pitch. This year, his 24.2% rate is the highest of his career in that situation, and he has gotten some good dividends from it, with a .909 OPS, his best mark since 2021. And yet, that efficiency has also not been able to appear against the mix of breaking pitches and off-speed pitches, where he has produced just a .209 xBA and .228 xSLG. Bogaerts still knows which pitch he wants to attack. The problem is that, increasingly, finding it no longer guarantees that he can do damage with it. As long as he's got flaws in his swing that are this exploitable, the Padres are going to have to find a way to navigate around a black hole in their lineup.
 -
Let’s be clear: Jackson Merrill did not rescue his season through luck or a sudden burst of bat speed. In fact, his first-half bat speed was 71.3 mph, the same figure he's posting during his subsequent breakout. What has changed is a decision about space and timing; Merrill understood that the problem was not how fast he moved the bat, but where on the plate he was delivering the barrel. To understand the adjustment, we have to look at how the league tried to neutralize him from the start. Opposing pitchers identified a pattern and threw him a clear combination of velocity and horizontal movement. The plan was straightforward: consistently fill the middle and outer portion of the hitting zone. This first Baseball Savant heat map shows that strategy perfectly. Pitch density clustered in the heart of the plate and along the outer half. Merrill entered the zone with an average attack angle of just 6°, an overly flat swing plane. Against pitches over the middle or away from his body, that lack of lift left him with almost no margin for impact. When he made contact, the ball came off softly toward the infield or died without elevation. Against the primary five pitches he saw (sweeper, fastball, cutter, slider and sinker), the result was a costly 26.4% whiff rate, a 25.8% strikeout rate and an average exit velocity of 89.6 mph. Pitchers did not need to hide the ball from him; they simply needed to throw over the plate, knowing his mechanics would not generate much damage. With a diagnosis like that, the solution at the major-league level is not to make the swing more violent in an attempt to pull the ball. It is about syncing up. Merrill kept the structure of his swing intact but moved his contact point a few inches farther out in front of him. By getting to the ball before it traveled deeper into the zone, his rate of ideal attack angle against that same pitch combination jumped from 43.4% to 51.4%. That allowed the barrel to work on an upward path at precisely the moment of impact. This will sound like ninth grade all over again, but it really did just require a change in geometry. Merrill's new attack has dismantled the opposition’s plan. As the second graphic shows, the league has tried to respond. Pitchers began targeting the upper and outer part of the zone, trying to get the ball above his new contact plane. But those elevated pitches along the far edge were no longer finding the late bat that had defined the beginning of his season. By reaching the contact point on time and with the right amount of lift, Merrill turned pitches in that area into his primary source of extra-base damage. Against the same group of pitches that had handcuffed him early, his average exit velocity jumped to 95.1 mph, his barrel rate went from 11.2% to 23.6%, and his expected slugging percentage reached a devastating .739. Against 263 pitches of those types during the second half, he has hit six home runs, nearly matching the nine he needed more than 1,100 pitches to produce at the beginning of the season. At the highest level of baseball, an adjustment is never permanent; it is simply a window of time in which the hitter gains the upper hand. By moving his contact point farther out in the second half, Jackson Merrill neutralized the plan the league had used to contain him. Now, the pressure is back on the pitchers, who have to find a new answer. View full article
-
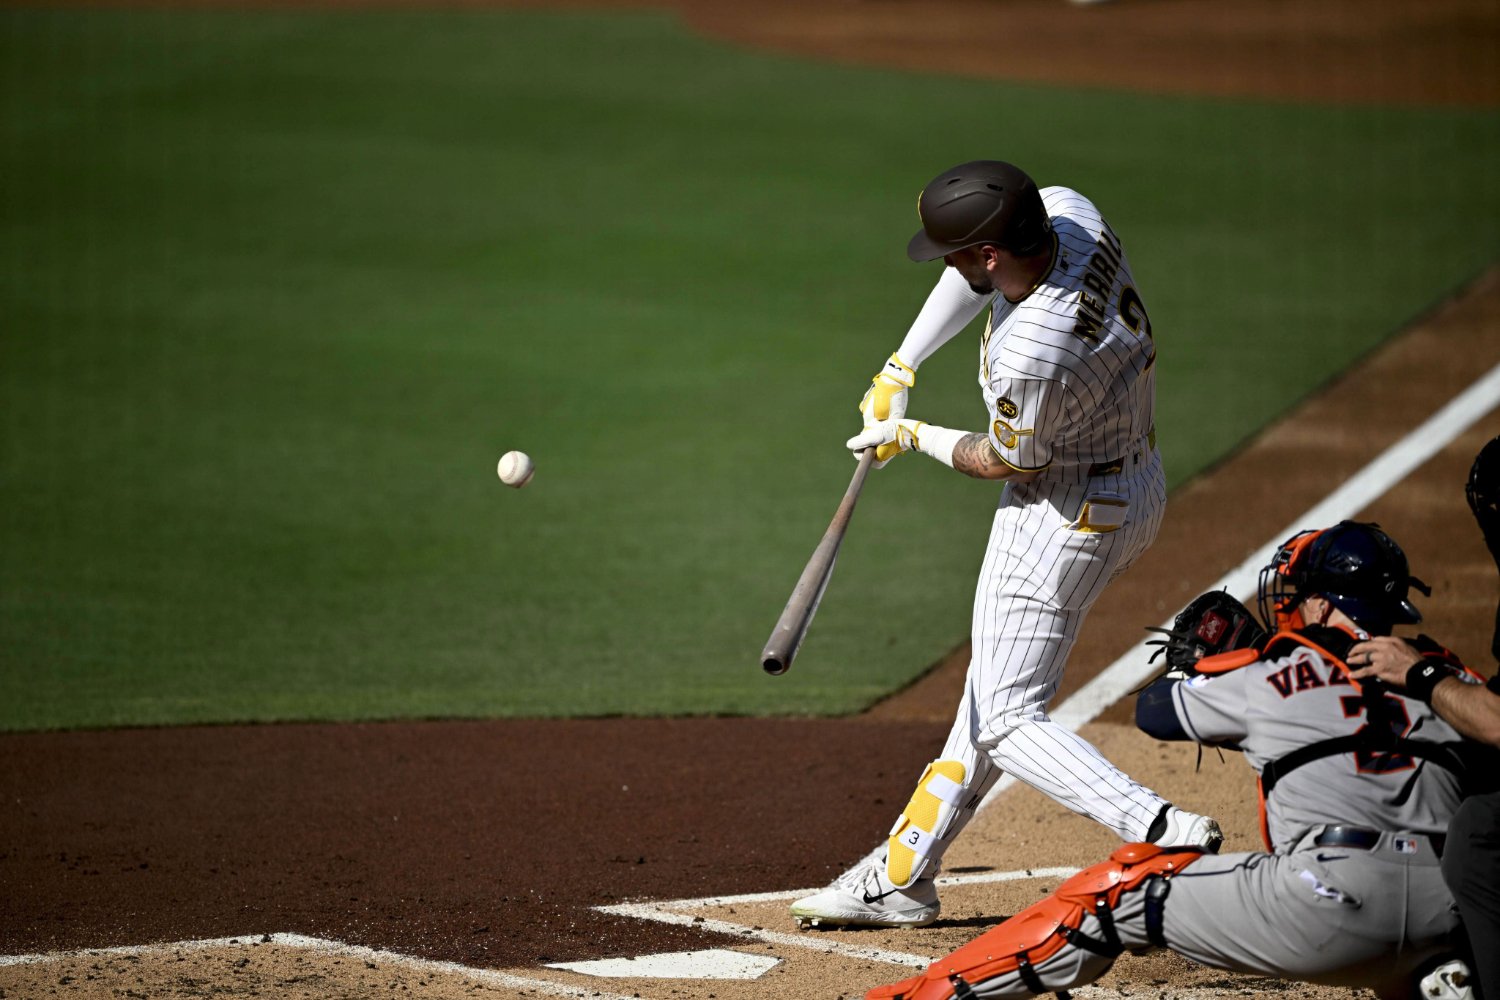 Let’s be clear: Jackson Merrill did not rescue his season through luck or a sudden burst of bat speed. In fact, his first-half bat speed was 71.3 mph, the same figure he's posting during his subsequent breakout. What has changed is a decision about space and timing; Merrill understood that the problem was not how fast he moved the bat, but where on the plate he was delivering the barrel. To understand the adjustment, we have to look at how the league tried to neutralize him from the start. Opposing pitchers identified a pattern and threw him a clear combination of velocity and horizontal movement. The plan was straightforward: consistently fill the middle and outer portion of the hitting zone. This first Baseball Savant heat map shows that strategy perfectly. Pitch density clustered in the heart of the plate and along the outer half. Merrill entered the zone with an average attack angle of just 6°, an overly flat swing plane. Against pitches over the middle or away from his body, that lack of lift left him with almost no margin for impact. When he made contact, the ball came off softly toward the infield or died without elevation. Against the primary five pitches he saw (sweeper, fastball, cutter, slider and sinker), the result was a costly 26.4% whiff rate, a 25.8% strikeout rate and an average exit velocity of 89.6 mph. Pitchers did not need to hide the ball from him; they simply needed to throw over the plate, knowing his mechanics would not generate much damage. With a diagnosis like that, the solution at the major-league level is not to make the swing more violent in an attempt to pull the ball. It is about syncing up. Merrill kept the structure of his swing intact but moved his contact point a few inches farther out in front of him. By getting to the ball before it traveled deeper into the zone, his rate of ideal attack angle against that same pitch combination jumped from 43.4% to 51.4%. That allowed the barrel to work on an upward path at precisely the moment of impact. This will sound like ninth grade all over again, but it really did just require a change in geometry. Merrill's new attack has dismantled the opposition’s plan. As the second graphic shows, the league has tried to respond. Pitchers began targeting the upper and outer part of the zone, trying to get the ball above his new contact plane. But those elevated pitches along the far edge were no longer finding the late bat that had defined the beginning of his season. By reaching the contact point on time and with the right amount of lift, Merrill turned pitches in that area into his primary source of extra-base damage. Against the same group of pitches that had handcuffed him early, his average exit velocity jumped to 95.1 mph, his barrel rate went from 11.2% to 23.6%, and his expected slugging percentage reached a devastating .739. Against 263 pitches of those types during the second half, he has hit six home runs, nearly matching the nine he needed more than 1,100 pitches to produce at the beginning of the season. At the highest level of baseball, an adjustment is never permanent; it is simply a window of time in which the hitter gains the upper hand. By moving his contact point farther out in the second half, Jackson Merrill neutralized the plan the league had used to contain him. Now, the pressure is back on the pitchers, who have to find a new answer.
 -
Robbie Ray’s surface numbers show a starter with a 3.08 ERA; his expected metrics reveal a pitcher with a 4.51 FIP trying to avoid a collapse. Without the overpowering fastball that defined his past, the 34-year-old left-hander has reinvented his arsenal to force rushed decisions in the batter’s box. In San Diego, the key will not be how many strikeouts he can accumulate, but how long he can maintain this disruption of hitters’ timing before the quality of contact catches up with him. The transformation begins with the loss of velocity on his fastball. With his four-seam fastball dropping to an average of 93.2 mph in 2026, hitters gained something they previously did not have: time. With a few extra hundredths of a second, batters can identify the pitch better, track it deeper into the plate, and delay their swing decisions. Once that urgency disappears, the pitcher’s advantage begins to erode. That temporal advantage reduced the impact of his fastball, the pitch that carried his identity for years. With a fastball that no longer creates the same level of threat, opponents are making contact inside the zone (Z-Contact%) 91.5% of the time and chasing fewer pitches outside of it. That forces Ray to attack the corners more often, and when he misses by only a small margin, counts extend and walks rise to 11.1%. That is where the real challenge of this version of Robbie Ray emerges. However, the reason to believe he can hold up in San Diego lies in the restructuring of his secondary pitches. Since his fastball no longer beats hitters as frequently as it once did, Ray has shifted more of his arsenal toward his changeup and knuckle curve. The former has limited opponents to a .196 batting average. The latter disrupts swing timing. Tracking data shows that 65.9% of swings against his curveball occur with hitters ahead of the pitch (Early%). In other words, batters are committing to their swings before recognizing the pitch’s final trajectory. Conditioned by the fastball, they accelerate their bodies too early. That timing disruption helps explain the pitch’s 35.1% Over%. The metric confirms that the barrel of the bat passes over the baseball when the hitter triggers the swing too early. Rather than chasing swings and misses, Ray’s objective with this profile is to limit the quality of contact by forcing weak contact above the barrel. That type of contact would not be equally sustainable in every environment. But Petco Park changes part of the equation. A pitcher with only a 36.3% ground-ball rate has room to survive thanks to the ballpark’s dimensions and its long-standing ability to suppress airborne damage, acting as a natural filter that can turn those harmless fly balls into routine outs for the outfielders. The Padres did not acquire the Robbie Ray who dominated hitters with a 96 mph fastball and won a Cy Young award. They acquired a pitcher who now needs to win each plate appearance in a completely different way. As long as he can continue disrupting the timing of opposing hitters, his ERA will have a chance to challenge a much less optimistic FIP. If he stops doing it, that margin will shrink and the results will begin to look more like the underlying metrics. View full article
-
Robbie Ray Is Walking A Timing Tightrope Ahead of His Padres Debut
Yirsandy Rodríguez posted an article in Padres
 Robbie Ray’s surface numbers show a starter with a 3.08 ERA; his expected metrics reveal a pitcher with a 4.51 FIP trying to avoid a collapse. Without the overpowering fastball that defined his past, the 34-year-old left-hander has reinvented his arsenal to force rushed decisions in the batter’s box. In San Diego, the key will not be how many strikeouts he can accumulate, but how long he can maintain this disruption of hitters’ timing before the quality of contact catches up with him. The transformation begins with the loss of velocity on his fastball. With his four-seam fastball dropping to an average of 93.2 mph in 2026, hitters gained something they previously did not have: time. With a few extra hundredths of a second, batters can identify the pitch better, track it deeper into the plate, and delay their swing decisions. Once that urgency disappears, the pitcher’s advantage begins to erode. That temporal advantage reduced the impact of his fastball, the pitch that carried his identity for years. With a fastball that no longer creates the same level of threat, opponents are making contact inside the zone (Z-Contact%) 91.5% of the time and chasing fewer pitches outside of it. That forces Ray to attack the corners more often, and when he misses by only a small margin, counts extend and walks rise to 11.1%. That is where the real challenge of this version of Robbie Ray emerges. However, the reason to believe he can hold up in San Diego lies in the restructuring of his secondary pitches. Since his fastball no longer beats hitters as frequently as it once did, Ray has shifted more of his arsenal toward his changeup and knuckle curve. The former has limited opponents to a .196 batting average. The latter disrupts swing timing. Tracking data shows that 65.9% of swings against his curveball occur with hitters ahead of the pitch (Early%). In other words, batters are committing to their swings before recognizing the pitch’s final trajectory. Conditioned by the fastball, they accelerate their bodies too early. That timing disruption helps explain the pitch’s 35.1% Over%. The metric confirms that the barrel of the bat passes over the baseball when the hitter triggers the swing too early. Rather than chasing swings and misses, Ray’s objective with this profile is to limit the quality of contact by forcing weak contact above the barrel. That type of contact would not be equally sustainable in every environment. But Petco Park changes part of the equation. A pitcher with only a 36.3% ground-ball rate has room to survive thanks to the ballpark’s dimensions and its long-standing ability to suppress airborne damage, acting as a natural filter that can turn those harmless fly balls into routine outs for the outfielders. The Padres did not acquire the Robbie Ray who dominated hitters with a 96 mph fastball and won a Cy Young award. They acquired a pitcher who now needs to win each plate appearance in a completely different way. As long as he can continue disrupting the timing of opposing hitters, his ERA will have a chance to challenge a much less optimistic FIP. If he stops doing it, that margin will shrink and the results will begin to look more like the underlying metrics.
 -
Jackson Merrill can still punish a fastball left over the heart of the plate. What has changed this year is the cost of missing anywhere else. That difference separates the hitter who tormented right-handed pitching during his first two seasons from the one carrying a 66 wRC+ against righties this year, the second-lowest mark among qualified left-handed hitters in Major League Baseball. During the 2024 and 2025 seasons, Merrill forced right-handers to pitch with uncommon precision. His swing was tuned to crush pitches down the middle, but it also inflicted damage on mistakes that drifted a few inches inside or above the strike zone. That version of Merrill turned nearly every poorly executed pitch into a chance at production. In 2026, that chance has become much more limited. That is why his contact-quality metrics tell a different story than his results. His Perfect Contact rate against fastballs remains at 22%, exactly where it was a year ago. His Flawed Swing rate has returned to 6%, while the average miss distance on his swings has barely changed from his first two seasons. If the swing itself were the problem, those numbers would have collapsed. Instead, what has changed is the quality of contact he generates after being forced to swing from less favorable positions. Jackson Merrill xwOBA Heat Map by Zone: 2024-25 vs. 2026 2024-2025 2026 The shift becomes clear when comparing the areas where Merrill once produced his best expected results. The upper outside quadrant has fallen from a .454 xwOBA to just .151. The middle-away portion of the zone has dropped from .440 to .303. The lower-middle area has declined from .513 to .322. Yet one number explains why this is not a story about a broken swing: the heart of the strike zone still belongs to Merrill. His xwOBA there remains at .498, only slightly below the .540 he produced over his first two seasons. Pitchers still pay a steep price whenever they leave a fastball over the middle. The difference is that they have found new locations where they can limit his damage. That adjustment has changed the entire structure of the at-bat. When a hitter threatens every part of the strike zone, pitchers eventually have no choice but to challenge him because there are few safe alternatives. Once that threat shrinks to a much smaller collection of locations, the sequence changes completely. They can work the edges more aggressively, elevate more often, expand the zone, and reserve the middle of the plate for far more specific situations. Pitch Location Distribution by Zone: 2024-25 vs. 2026 2024-25 2026 The numbers confirm that adjustment. The share of pitches Merrill has seen over the heart of the plate has dropped from 7.9% during 2024 and 2025 to just 5.6% this season. That may sound like a small difference, but it represents hundreds of pitching decisions over the course of a full season. The difference also shows up once the ball leaves his bat. His hard-hit rate against right-handed pitching has fallen from 52.2% as a rookie to 39.2% this season. His weak-contact rate has climbed from 9.8% to 16.2%, while his ISO has dropped from .235 to .137. There is still room for a rebound. Merrill owns a .336 xwOBA against right-handed pitching, well above his actual .263 wOBA, while a .240 BABIP suggests bad luck has played a role in his disappointing production. Even if those results improve, however, the challenge will remain the same. The league has already made the first adjustment. Pitchers have redrawn Jackson Merrill's offensive map and reshaped the way they attack him. The next move belongs to Merrill. View full article
-
 Jackson Merrill can still punish a fastball left over the heart of the plate. What has changed this year is the cost of missing anywhere else. That difference separates the hitter who tormented right-handed pitching during his first two seasons from the one carrying a 66 wRC+ against righties this year, the second-lowest mark among qualified left-handed hitters in Major League Baseball. During the 2024 and 2025 seasons, Merrill forced right-handers to pitch with uncommon precision. His swing was tuned to crush pitches down the middle, but it also inflicted damage on mistakes that drifted a few inches inside or above the strike zone. That version of Merrill turned nearly every poorly executed pitch into a chance at production. In 2026, that chance has become much more limited. That is why his contact-quality metrics tell a different story than his results. His Perfect Contact rate against fastballs remains at 22%, exactly where it was a year ago. His Flawed Swing rate has returned to 6%, while the average miss distance on his swings has barely changed from his first two seasons. If the swing itself were the problem, those numbers would have collapsed. Instead, what has changed is the quality of contact he generates after being forced to swing from less favorable positions. Jackson Merrill xwOBA Heat Map by Zone: 2024-25 vs. 2026 2024-2025 2026 The shift becomes clear when comparing the areas where Merrill once produced his best expected results. The upper outside quadrant has fallen from a .454 xwOBA to just .151. The middle-away portion of the zone has dropped from .440 to .303. The lower-middle area has declined from .513 to .322. Yet one number explains why this is not a story about a broken swing: the heart of the strike zone still belongs to Merrill. His xwOBA there remains at .498, only slightly below the .540 he produced over his first two seasons. Pitchers still pay a steep price whenever they leave a fastball over the middle. The difference is that they have found new locations where they can limit his damage. That adjustment has changed the entire structure of the at-bat. When a hitter threatens every part of the strike zone, pitchers eventually have no choice but to challenge him because there are few safe alternatives. Once that threat shrinks to a much smaller collection of locations, the sequence changes completely. They can work the edges more aggressively, elevate more often, expand the zone, and reserve the middle of the plate for far more specific situations. Pitch Location Distribution by Zone: 2024-25 vs. 2026 2024-25 2026 The numbers confirm that adjustment. The share of pitches Merrill has seen over the heart of the plate has dropped from 7.9% during 2024 and 2025 to just 5.6% this season. That may sound like a small difference, but it represents hundreds of pitching decisions over the course of a full season. The difference also shows up once the ball leaves his bat. His hard-hit rate against right-handed pitching has fallen from 52.2% as a rookie to 39.2% this season. His weak-contact rate has climbed from 9.8% to 16.2%, while his ISO has dropped from .235 to .137. There is still room for a rebound. Merrill owns a .336 xwOBA against right-handed pitching, well above his actual .263 wOBA, while a .240 BABIP suggests bad luck has played a role in his disappointing production. Even if those results improve, however, the challenge will remain the same. The league has already made the first adjustment. Pitchers have redrawn Jackson Merrill's offensive map and reshaped the way they attack him. The next move belongs to Merrill.
 -
Yuki Matsui's 2.23 ERA tells a simple story: A left-handed reliever misses bats at an elite rate, strands nearly every baserunner he allows, and has become another dependable late-inning arm for the San Diego Padres. The good news? The results support that story. But they also raise one important question: Why do the projection metrics paint such a different picture? Both his FIP and xFIP sit above 4.90, a gap that usually points toward regression. Most of the time, that kind of separation suggests a pitcher has benefited from good fortune. Matsui's season doesn't fit that explanation. He is a reliever who has learned to survive baseball's highest-leverage moments without relying on the weapon that usually defines elite bullpen arms: the strikeout. That starts with his ability to miss bats. According to Baseball Savant, Matsui ranks in the 98th percentile in whiff rate across Major League Baseball, proof that hitters still struggle to pick up his arsenal. His splitter remains his best weapon, while his slider gives hitters a completely different look behind a fastball that sits around 92 mph. By itself, that profile isn’t unusual. Plenty of relievers generate whiffs. What separates Matsui happens after hitters make contact. His 94.6% left-on-base rate is almost impossible to sustain over a full season. The easy explanation is luck. The real question is whether luck explains all of it. With runners in scoring position from the fifth inning on, the picture changes. Pitcher PA BA xBA Whiff% Hard Hit% Attack Angle Bryan Baker 27 .038 .106 46.3 25 14° Chase Burns 20 .100 .151 42.4 30.8 11° Yuki Matsui 26 .143 .115 39.4 42.9 15° Gabe Speier 25 .083 .120 23.7 29.4 9° One number immediately stands out: Matsui owns one of the highest hard-hit rates in the group. In theory, that should lead to more offensive production. Instead, only Bryan Baker has allowed a lower expected batting average, and Baker gets there by overwhelming hitters with strikeouts. Matsui arrives at the same destination by taking a different route. His strikeout rate with runners in scoring position is just 19.2%, one of the lowest among these pitchers. Baker is above 40%. Chase Burns sits above 30%. Instead, the southpaw is surviving in the pressure moments by preventing hits. That distinction changes the entire evaluation of his season. Hard-Hit% measures exit velocity, not where the ball goes. A hard-hit ball can become a home run or a harmless fly ball. Launch angle often determines the difference. For Matsui, opponents have produced an average Attack Angle of 15 degrees, the highest among this group. They've hit the ball hard, but much of that contact has followed trajectories that favor the defense instead of producing extra-base hits. His .100 BABIP with runners in scoring position stops looking like a fluke once the contact profile enters the discussion. Statcast reaches the same conclusion. His expected batting average (.115) is actually lower than the .143 batting average he's allowed. That calls for a different interpretation of his season. Regression still belongs in the conversation because a left-on-base rate approaching 95% rarely survives a full year. Matsui also continues to issue too many walks, creating traffic that helps explain why FIP and xFIP remain skeptical. What those metrics don't capture as well is what happens after that traffic appears. The answer goes back to his arsenal. His fastball has become less prominent since arriving in the majors, while the Padres have leaned harder into the combination that best fits his strengths. The splitter disappears beneath the strike zone and generates empty swings. The slider changes both timing and swing plane. Hitters rarely get the same look twice within an at-bat. There's also a human element behind this season. Matsui opened the year on the injured list for the third straight year before returning in May. Many relievers need weeks to regain their feel after missing part of spring training. Matsui found his almost immediately, put together one of San Diego's longest scoreless streaks out of the bullpen, and resumed handling inherited runners as if he had never left. The second half will determine how much of his ERA belongs to variance. His performance with runners in scoring position already points to a skill that extends beyond luck. Some relievers escape jams by missing every bat. Matsui has found another way: turning contact into far less damage than it should produce. View full article
-
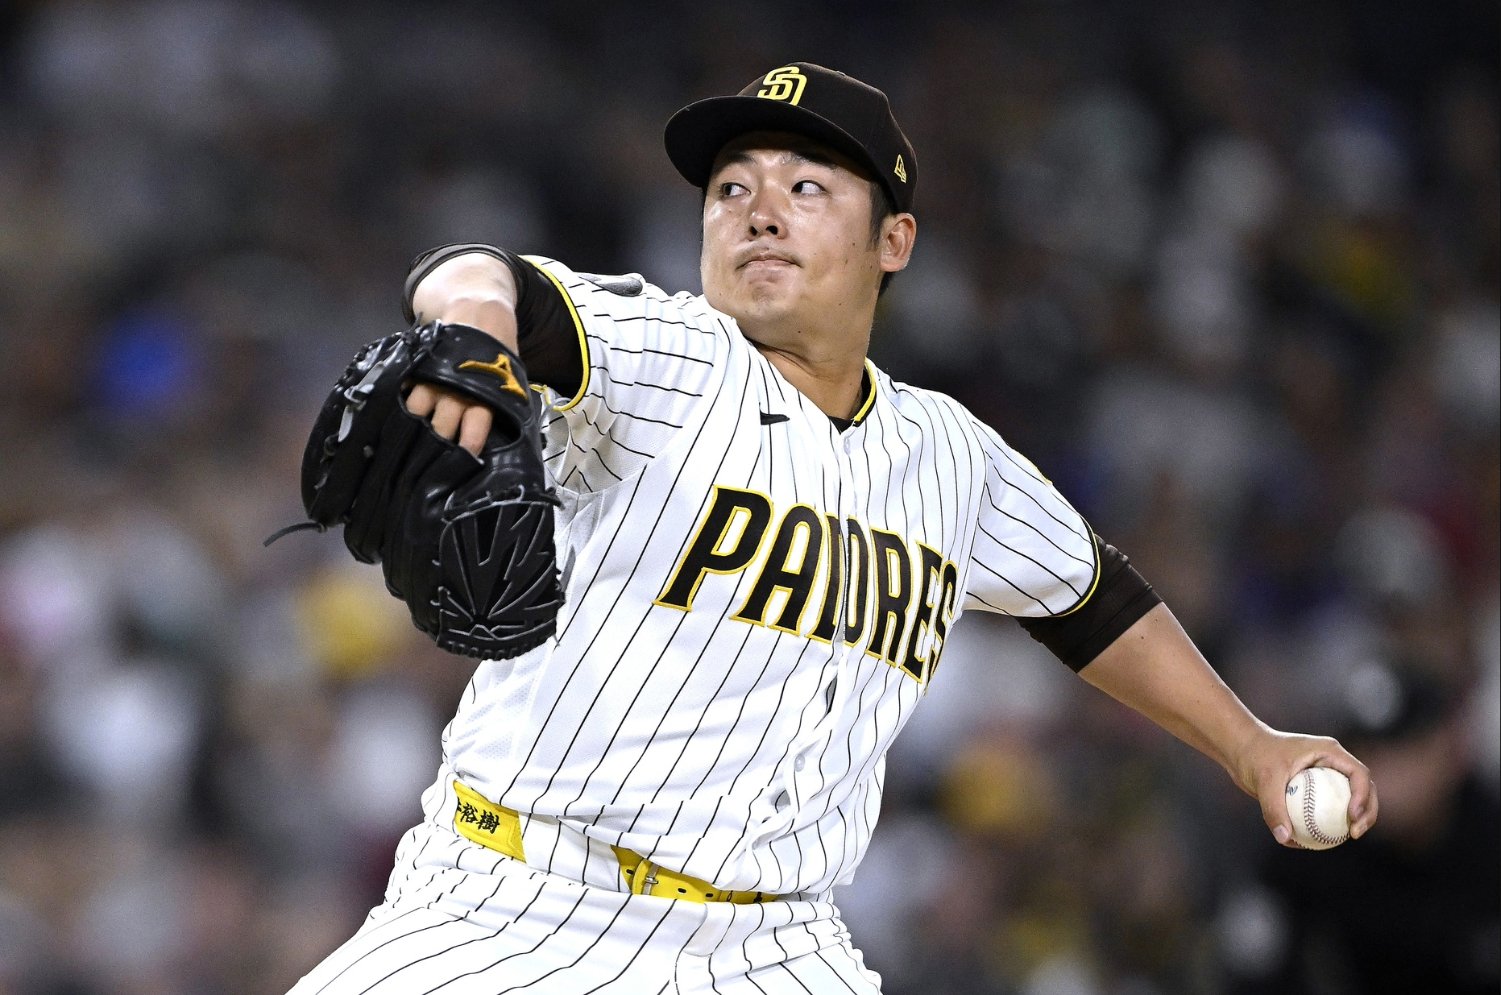 Yuki Matsui's 2.23 ERA tells a simple story: A left-handed reliever misses bats at an elite rate, strands nearly every baserunner he allows, and has become another dependable late-inning arm for the San Diego Padres. The good news? The results support that story. But they also raise one important question: Why do the projection metrics paint such a different picture? Both his FIP and xFIP sit above 4.90, a gap that usually points toward regression. Most of the time, that kind of separation suggests a pitcher has benefited from good fortune. Matsui's season doesn't fit that explanation. He is a reliever who has learned to survive baseball's highest-leverage moments without relying on the weapon that usually defines elite bullpen arms: the strikeout. That starts with his ability to miss bats. According to Baseball Savant, Matsui ranks in the 98th percentile in whiff rate across Major League Baseball, proof that hitters still struggle to pick up his arsenal. His splitter remains his best weapon, while his slider gives hitters a completely different look behind a fastball that sits around 92 mph. By itself, that profile isn’t unusual. Plenty of relievers generate whiffs. What separates Matsui happens after hitters make contact. His 94.6% left-on-base rate is almost impossible to sustain over a full season. The easy explanation is luck. The real question is whether luck explains all of it. With runners in scoring position from the fifth inning on, the picture changes. Pitcher PA BA xBA Whiff% Hard Hit% Attack Angle Bryan Baker 27 .038 .106 46.3 25 14° Chase Burns 20 .100 .151 42.4 30.8 11° Yuki Matsui 26 .143 .115 39.4 42.9 15° Gabe Speier 25 .083 .120 23.7 29.4 9° One number immediately stands out: Matsui owns one of the highest hard-hit rates in the group. In theory, that should lead to more offensive production. Instead, only Bryan Baker has allowed a lower expected batting average, and Baker gets there by overwhelming hitters with strikeouts. Matsui arrives at the same destination by taking a different route. His strikeout rate with runners in scoring position is just 19.2%, one of the lowest among these pitchers. Baker is above 40%. Chase Burns sits above 30%. Instead, the southpaw is surviving in the pressure moments by preventing hits. That distinction changes the entire evaluation of his season. Hard-Hit% measures exit velocity, not where the ball goes. A hard-hit ball can become a home run or a harmless fly ball. Launch angle often determines the difference. For Matsui, opponents have produced an average Attack Angle of 15 degrees, the highest among this group. They've hit the ball hard, but much of that contact has followed trajectories that favor the defense instead of producing extra-base hits. His .100 BABIP with runners in scoring position stops looking like a fluke once the contact profile enters the discussion. Statcast reaches the same conclusion. His expected batting average (.115) is actually lower than the .143 batting average he's allowed. That calls for a different interpretation of his season. Regression still belongs in the conversation because a left-on-base rate approaching 95% rarely survives a full year. Matsui also continues to issue too many walks, creating traffic that helps explain why FIP and xFIP remain skeptical. What those metrics don't capture as well is what happens after that traffic appears. The answer goes back to his arsenal. His fastball has become less prominent since arriving in the majors, while the Padres have leaned harder into the combination that best fits his strengths. The splitter disappears beneath the strike zone and generates empty swings. The slider changes both timing and swing plane. Hitters rarely get the same look twice within an at-bat. There's also a human element behind this season. Matsui opened the year on the injured list for the third straight year before returning in May. Many relievers need weeks to regain their feel after missing part of spring training. Matsui found his almost immediately, put together one of San Diego's longest scoreless streaks out of the bullpen, and resumed handling inherited runners as if he had never left. The second half will determine how much of his ERA belongs to variance. His performance with runners in scoring position already points to a skill that extends beyond luck. Some relievers escape jams by missing every bat. Matsui has found another way: turning contact into far less damage than it should produce.
 -
There is one number that follows Bradgley Rodriguez everywhere. Not a highlight, not a moment, but a data point: 41%. That is how often he throws his changeup. For a pitcher sitting 98.1 mph on the fastball, that alone makes the profile feel off-axis. Most pitchers with that kind of velocity lean on the fastball as the thing that organizes everything else. Rodríguez has gone the other way. The four-seam is almost background noise now, while the changeup has taken over as the pitch that actually drives the structure of the arsenal. It wasn't always like this. In 2025 at Double-A, Rodríguez looked dominant on paper: 12.49 K/9, 2.01 BB/9, 0.90 WHIP. But Triple-A changed the environment quickly. The strikeouts dropped to 4.40 K/9, walks jumped to 6.91 BB/9, and his xFIP climbed to 6.06. It was not a velocity issue; the fastball was still there. The problem was that more advanced hitters could handle the hard stuff. What followed was not a tweak, but a full reordering of usage. In 2026, the changeup has become his unquestionable primary offering, while the four-seam fell to a 22.3% usage rate. The sinker stayed at 27.1% as the stabilizing piece of the mix. The slider (8.3%) slid in as a fourth option, effectively taking the cutter’s place from 2025 (10.2%). It is not really a power arsenal in the traditional sense. It works more like a set of overlapping speeds that share the same visual window for as long as possible. Bradgley Rodriguez Changeup Performance Metric 2025 2026 MLB Average Usage 23.6% 41% ~15% BA Against .000 .123 .220 SLG Against .000 .193 .350 Whiff% 46.7% 39.1% ~25% Exit Velocity 91.2 mph 84.2 mph 89 mph HardHit% 33.3% 28.6% ~38% The changeup holds up even under heavy usage, which is really the point here. He only threw 30 of them all of last year in San Diego; he's already up to 253 in 2026. The surface line is strong on its own, but the underlying data actually pushes it a bit further (.126 xBA, .180 xSLG). That gap is usually where volatility shows up. Here, it does not really appear in a meaningful way. What matters more than the whiff rate itself is how consistently the pitch avoids damage contact. Even when hitters do put it in play, it tends to stay on the ground or come off the bat soft, which is not something that usually survives when a pitch becomes a primary option in the mix. The entire pitch works because of how it pairs with the sinker. Rodríguez’s changeup drops 25.6 inches with 17.3 inches of arm-side run. The sinker sits at 16.9 and 14.9. On paper, they are not identical, but visually they live in the same lane for most of the flight. Then the speed gap does the rest. The sinker comes in at 97.7 mph. The changeup sits at 89.4. By the time it arrives at the plate, it is usually too late to adjust. The result is a lot of early swings, a lot of contact under the ball, and a 47.1% topped rate that sits at the top of the league. It is less about swing quality and more about when the swing decision is being forced. Rodríguez is not winning on pure stuff. His Stuff+ sits at 101, basically average. The jump is in execution. His first-pitch strikes have noticeably increased from 41.9% to 61.5%; his in-zone rate from 45.7% to 50.7%. The changeup stopped being just a swing-and-miss pitch and became something closer to a placement tool, living on edges and expanding chase zones rather than the heart of the plate. The sinker, despite the velocity, is not really an out pitch in isolation. It plays more as a shape connector, something that keeps the fastball-changeup tunnel intact. The results (.300 BA, .375 SLG, 14.1% whiff) back that up—it is useful, but it is not driving outcomes on its own. The fastball ends up in a similar role. It is not dominating at all. The production is neutral (.280 BA, .341 xSLG), but its value is tied to perception. It keeps 98 mph in the hitter’s mind, even if it is not actually finishing at-bats very often. The question that sits underneath all of this is sustainability. A changeup sitting around 40% usage is still unusual in MLB, even among pitchers who lean heavily on off-speed offers. It is not a common workload distribution, and there are not many stable comparisons for it. The pitch value has dropped from 4.7 to 2.5 runs per 100 pitches, and the whiff rate has come down from the 46.7% rate last year. That looks like regression at first glance, but the underlying indicators suggest something closer to adjustment under increased exposure rather than a real collapse in quality. The slider is the one real development lane left. It has a 128 Stuff+, which usually signals upside, but the results have not followed (-1.6 runs/100, .308 BA, .538 SLG, 36.4% whiff, 55.6% hard-hit rate). The shape is not the problem. The execution is still inconsistent enough that hitters are not being disrupted in the same way as with the changeup. Rodríguez is 22, so there is still time for this to evolve, but the core problem is already solved. He has restructured the hierarchy of his arsenal. Instead of building around a 98-mph fastball, he pushed it into a supporting role inside a system driven by a high-usage changeup. It works right now because the command holds everything together, but the entire model still depends on whether that separation in timing holds as hitters see more of it. View full article
-
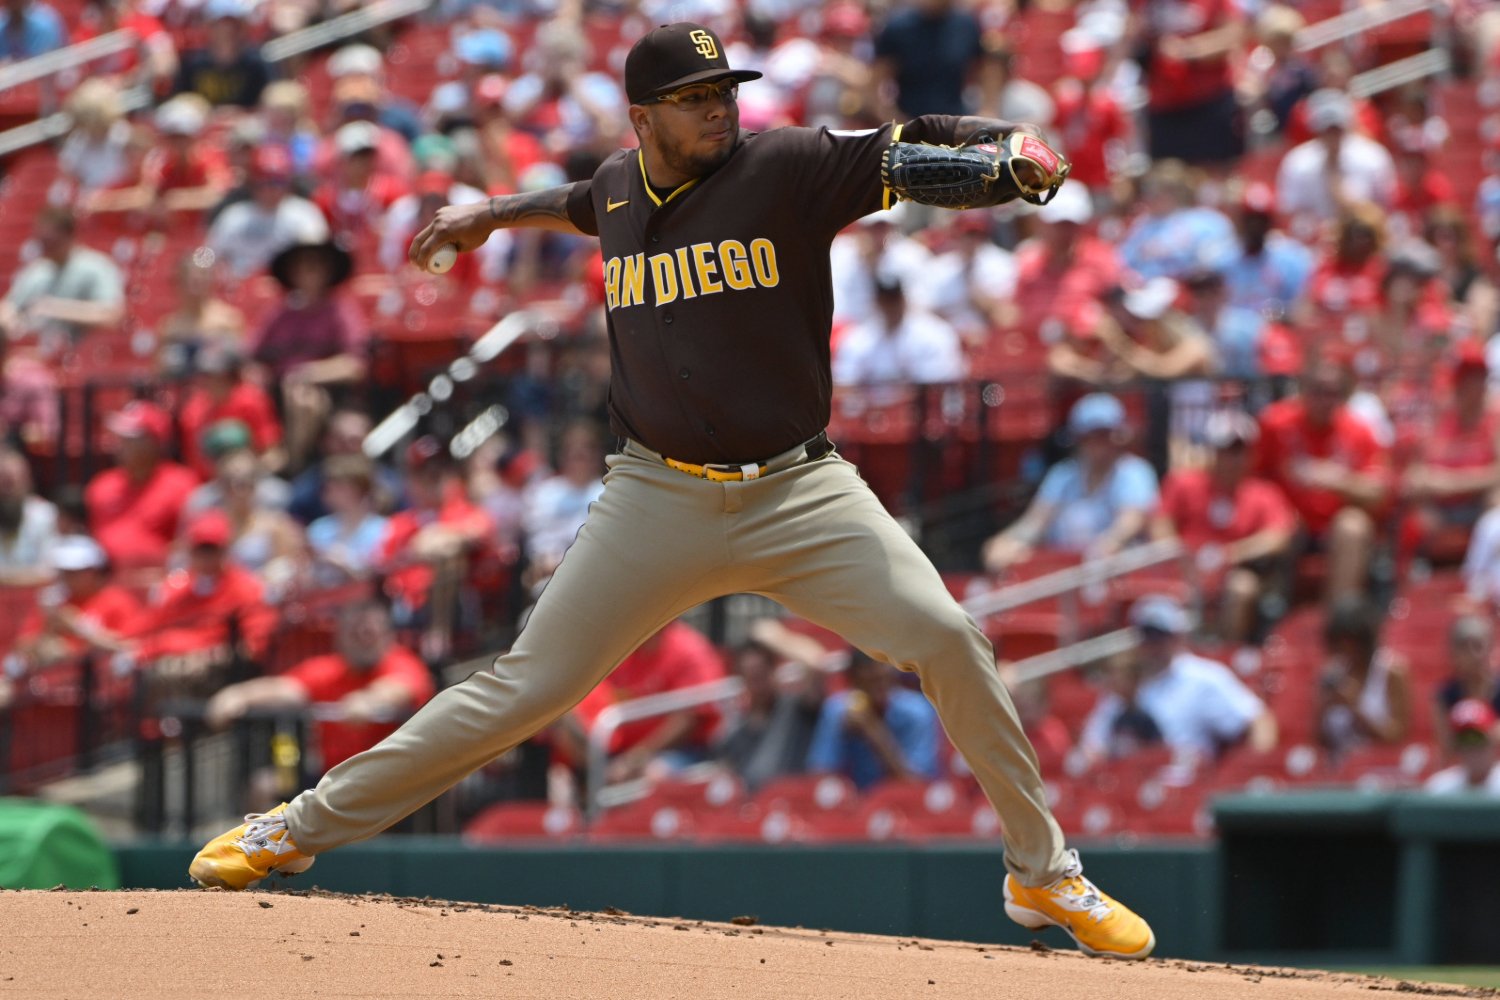 There is one number that follows Bradgley Rodriguez everywhere. Not a highlight, not a moment, but a data point: 41%. That is how often he throws his changeup. For a pitcher sitting 98.1 mph on the fastball, that alone makes the profile feel off-axis. Most pitchers with that kind of velocity lean on the fastball as the thing that organizes everything else. Rodríguez has gone the other way. The four-seam is almost background noise now, while the changeup has taken over as the pitch that actually drives the structure of the arsenal. It wasn't always like this. In 2025 at Double-A, Rodríguez looked dominant on paper: 12.49 K/9, 2.01 BB/9, 0.90 WHIP. But Triple-A changed the environment quickly. The strikeouts dropped to 4.40 K/9, walks jumped to 6.91 BB/9, and his xFIP climbed to 6.06. It was not a velocity issue; the fastball was still there. The problem was that more advanced hitters could handle the hard stuff. What followed was not a tweak, but a full reordering of usage. In 2026, the changeup has become his unquestionable primary offering, while the four-seam fell to a 22.3% usage rate. The sinker stayed at 27.1% as the stabilizing piece of the mix. The slider (8.3%) slid in as a fourth option, effectively taking the cutter’s place from 2025 (10.2%). It is not really a power arsenal in the traditional sense. It works more like a set of overlapping speeds that share the same visual window for as long as possible. Bradgley Rodriguez Changeup Performance Metric 2025 2026 MLB Average Usage 23.6% 41% ~15% BA Against .000 .123 .220 SLG Against .000 .193 .350 Whiff% 46.7% 39.1% ~25% Exit Velocity 91.2 mph 84.2 mph 89 mph HardHit% 33.3% 28.6% ~38% The changeup holds up even under heavy usage, which is really the point here. He only threw 30 of them all of last year in San Diego; he's already up to 253 in 2026. The surface line is strong on its own, but the underlying data actually pushes it a bit further (.126 xBA, .180 xSLG). That gap is usually where volatility shows up. Here, it does not really appear in a meaningful way. What matters more than the whiff rate itself is how consistently the pitch avoids damage contact. Even when hitters do put it in play, it tends to stay on the ground or come off the bat soft, which is not something that usually survives when a pitch becomes a primary option in the mix. The entire pitch works because of how it pairs with the sinker. Rodríguez’s changeup drops 25.6 inches with 17.3 inches of arm-side run. The sinker sits at 16.9 and 14.9. On paper, they are not identical, but visually they live in the same lane for most of the flight. Then the speed gap does the rest. The sinker comes in at 97.7 mph. The changeup sits at 89.4. By the time it arrives at the plate, it is usually too late to adjust. The result is a lot of early swings, a lot of contact under the ball, and a 47.1% topped rate that sits at the top of the league. It is less about swing quality and more about when the swing decision is being forced. Rodríguez is not winning on pure stuff. His Stuff+ sits at 101, basically average. The jump is in execution. His first-pitch strikes have noticeably increased from 41.9% to 61.5%; his in-zone rate from 45.7% to 50.7%. The changeup stopped being just a swing-and-miss pitch and became something closer to a placement tool, living on edges and expanding chase zones rather than the heart of the plate. The sinker, despite the velocity, is not really an out pitch in isolation. It plays more as a shape connector, something that keeps the fastball-changeup tunnel intact. The results (.300 BA, .375 SLG, 14.1% whiff) back that up—it is useful, but it is not driving outcomes on its own. The fastball ends up in a similar role. It is not dominating at all. The production is neutral (.280 BA, .341 xSLG), but its value is tied to perception. It keeps 98 mph in the hitter’s mind, even if it is not actually finishing at-bats very often. The question that sits underneath all of this is sustainability. A changeup sitting around 40% usage is still unusual in MLB, even among pitchers who lean heavily on off-speed offers. It is not a common workload distribution, and there are not many stable comparisons for it. The pitch value has dropped from 4.7 to 2.5 runs per 100 pitches, and the whiff rate has come down from the 46.7% rate last year. That looks like regression at first glance, but the underlying indicators suggest something closer to adjustment under increased exposure rather than a real collapse in quality. The slider is the one real development lane left. It has a 128 Stuff+, which usually signals upside, but the results have not followed (-1.6 runs/100, .308 BA, .538 SLG, 36.4% whiff, 55.6% hard-hit rate). The shape is not the problem. The execution is still inconsistent enough that hitters are not being disrupted in the same way as with the changeup. Rodríguez is 22, so there is still time for this to evolve, but the core problem is already solved. He has restructured the hierarchy of his arsenal. Instead of building around a 98-mph fastball, he pushed it into a supporting role inside a system driven by a high-usage changeup. It works right now because the command holds everything together, but the entire model still depends on whether that separation in timing holds as hitters see more of it.
